
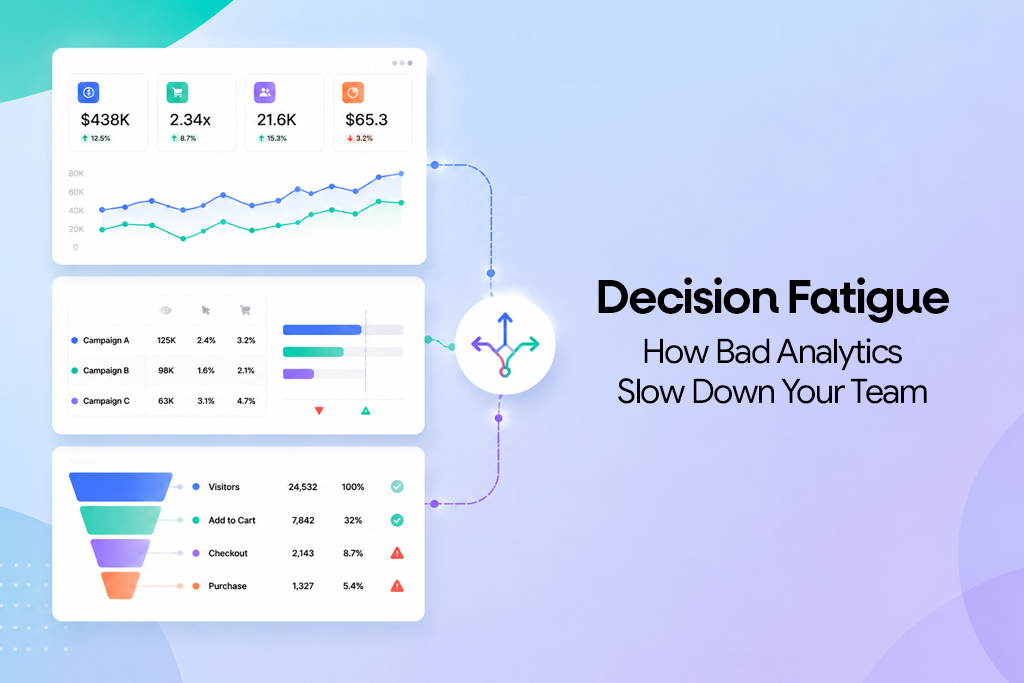
Every growing ecommerce business eventually builds the same trap.
You add dashboards. You run weekly reports. You track ad performance across Meta, Google, and GA4. You pull Shopify exports. You monitor retention in one tool, revenue in another, and margins somewhere in a spreadsheet. You do all of this because you want more clarity and more control.
But after a certain point, more data does not create more clarity.
It creates decision fatigue. And decision fatigue is quietly one of the most expensive problems in ecommerce today.
This post breaks down exactly how analytics overload causes decision fatigue in business, why bad data quality makes it worse, and what better reporting looks like for teams that want to move faster.
Decision fatigue is the mental drain that accumulates when people are forced to make too many decisions, or process too many options, without enough clarity to act confidently.
In business, it rarely looks dramatic. It shows up in small, repeated delays that compound over time.
It looks like this:
different numbers.
shows.
in with a different version of performance.
That is decision fatigue in business. And it is almost always a reporting system problem, not a people problem.
When the analytics setup is broken, teams spend their best thinking energy on finding, cleaning, comparing, and defending data. By the time they reach the actual business question, they are already mentally depleted.
Research published on PubMed Central describes decision fatigue as an impaired ability to make decisions and control behaviour after repeated decision-making. In business, this happens when teams process too many unclear reports and conflicting dashboards before arriving at one decision.
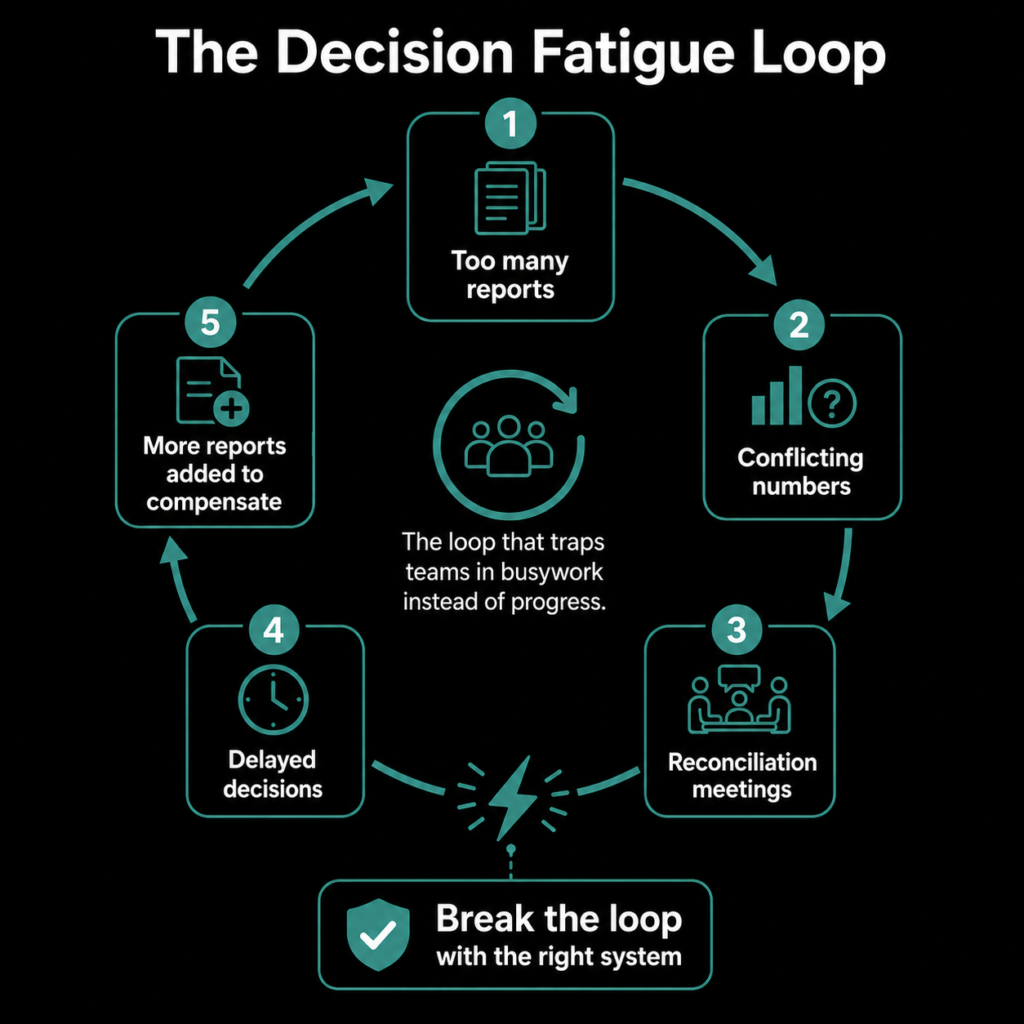
Analytics cause decision fatigue when they generate more interpretation work than decision support.
A useful analytics system should help a team answer three questions quickly:
Bad analytics does the opposite. It gives teams more charts, tabs, filters, exports, and dashboards without pointing clearly to the next action.
Consider a typical ecommerce morning:
Once the team starts questioning which number to trust, the meeting has already gone sideways.
The campaign is forgotten. Now it is attribution windows, mismatched date ranges, and the same Meta-versus-Shopify argument the team had two weeks ago. The meeting moved from growth to troubleshooting without anyone noticing.
The issue is never analytics itself. It is analytics built without a clear structure, shared definitions, or any link to what action comes next.
Related read: How to Stop Drowning in Data and Start Making Decisions?
See how NetSights turns scattered data into clear decisions.
Connect your Shopify store, ad accounts, and finance data in one view.
Too many reports slow business teams because every report adds another layer of interpretation before anyone can act.
A daily sales report says one thing. A weekly marketing dashboard says another. A finance sheet shows a third version. A founder’s custom tracker has a fourth. The more reports a team creates, the more time it spends comparing reports instead of solving problems.
McKinsey research on decision making finds that executives spend nearly 40 percent of their time making decisions and believe much of that time is poorly used. When reports are fragmented or unclear, decision time becomes even less productive.
This is especially visible in ecommerce businesses where every team builds its own reporting view in isolation:
Each team is right from its own perspective. But leadership decisions need one connected view. Without it, every meeting gets stuck on questions like:
These questions are valid. But if the same questions come up every week, the reporting system is costing the business more than it is helping.
Related read: 5 Weekly Ecommerce Metrics Every Founder Should Track
Bad data does not just produce wrong numbers. It produces a team that stops believing any numbers. From that point, every report gets checked, cross-referenced, and manually confirmed before anyone acts on it. The dashboard is still open. The decisions are happening somewhere else.
Poor data quality appears in many forms:
Each of these issues creates friction. And friction slows decisions.
Gartner research on data quality reports that poor data quality costs organisations an average of $12.9 million per year. For ecommerce businesses, this shows up as wasted ad spend, wrong budget allocation, delayed campaign action, and low confidence in any reporting.
A team can move quickly with imperfect but consistently trusted data. It cannot move at all with polished dashboards that no one believes.
Poor data quality is not only a technical problem. It is an operating problem. When teams cannot trust the data, they cannot trust the decision.
Many businesses try to solve analytics overload by redesigning a cleaner dashboard. A cleaner dashboard helps, but it does not fix the root cause if the reporting logic underneath is still broken.
Analytics overload usually comes from four deeper structural problems:
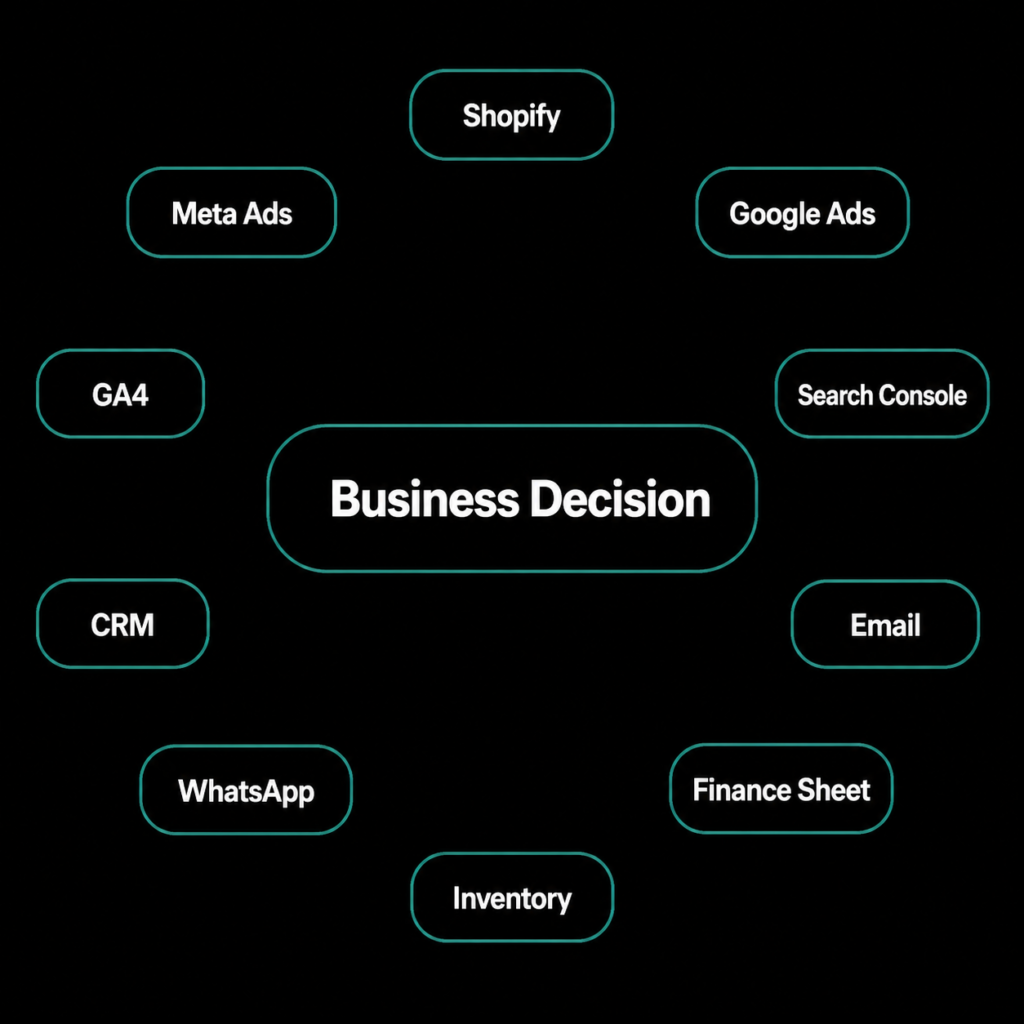
Shopify, Meta Ads, Google Ads, GA4, Search Console, CRM, email, WhatsApp, shipping, inventory, and finance data all sit in different places. Teams move between ten platforms to answer one business question.
Revenue, orders, AOV, ROAS, CAC, LTV, repeat rate, margin, refund rate, conversion rate, CTR, CPC, CPM, stock availability, and product performance are all useful. But they are not all equally urgent every day. Without a priority layer, teams treat everything as equally important and therefore nothing gets proper attention.
One team defines revenue before discounts. Another defines it after. One calculates CAC at campaign level. Another uses blended acquisition cost. Both can be useful, but mixing them in the same decision conversation leads to conflicting conclusions and circular meetings.
A dashboard may show that revenue dropped last week. But it may not explain whether the drop came from lower traffic, weaker conversion rate, stockouts, reduced ad spend, discount-heavy orders, low repeat purchase rates, or landing page issues. Without that context, the team cannot act.
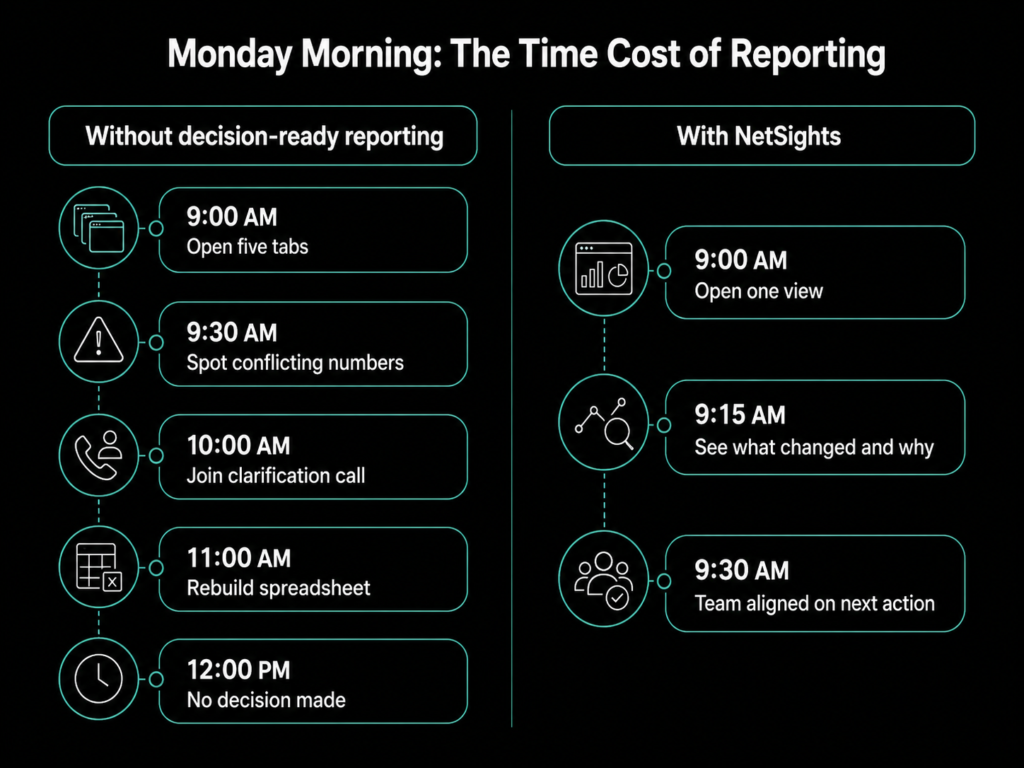
What if Monday started with clarity?
Connect Shopify, Meta, Google, and finance data into one view with NetSights.
Analytics overload happens when people are left to manually connect these dots. This is why standard ecommerce dashboards often fail to solve the real problem: they display numbers, but they do not help the team decide what to do.
Related read: NetSights vs Traditional Ecommerce Dashboards
Dashboard fatigue happens when teams stop relying on dashboards because the dashboards no longer help them make decisions.
It develops gradually. At first the team checks every dashboard carefully. Then the dashboard starts taking too long to interpret. Then someone asks for a manual summary. Then someone builds a spreadsheet. Then someone else builds a different one. Eventually, the dashboard still exists in a browser tab, but real decision-making has moved into messaging threads, meetings, and manual calculations.
A dashboard that is not trusted becomes decoration. A report too complex to interpret gets ignored. A metric that does not lead to action becomes noise.
Asana’s Anatomy of Work Index reports that 60 percent of a person’s working time is spent on “work about work” rather than their actual skilled work. In analytics-heavy teams, this looks like preparing reports, joining data clarification meetings, rebuilding the same spreadsheets, and chasing number verification.
The real cost of dashboard fatigue is not the software subscription. It is the delay between noticing a problem and acting on it.
Small problems compound fast when they go unaddressed. Delay is not neutral. Every week of inaction on an underperforming campaign, a stocking issue, or a conversion rate drop has a cost.
Related read: The Cost of Inaction in Business Growth
Good analytics should reduce thinking friction, not add to it.
That does not mean teams should stop thinking. It means the system should remove unnecessary interpretation work so people can focus on the actual business decision, not the process of arriving at it.
A strong analytics system should:
For ecommerce teams, this means one connected reporting view that links revenue, orders, ad spend, CAC, ROAS, conversion rate, AOV, margin, retention, inventory, and channel performance.
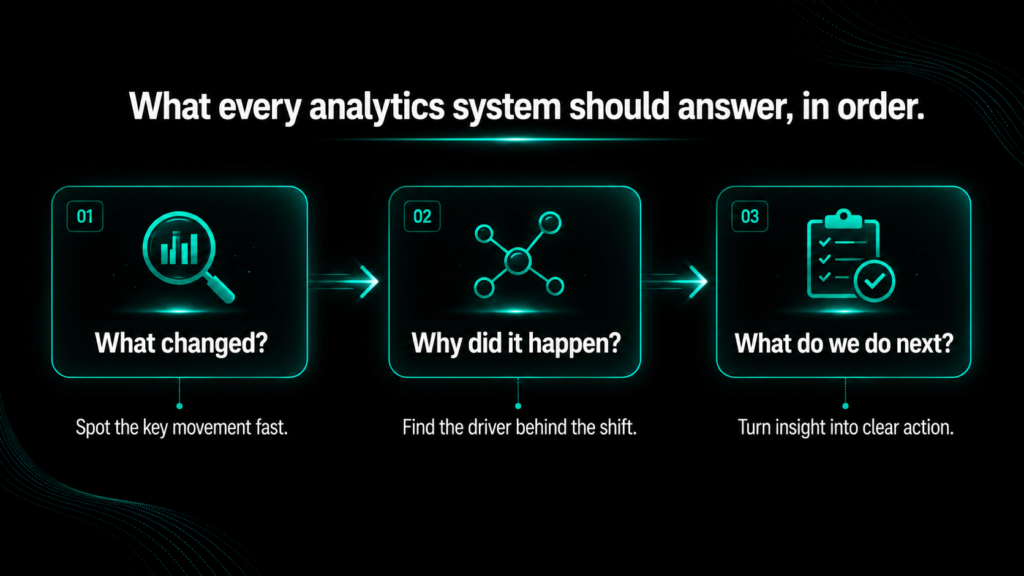
If revenue drops, the team should not need five tools to understand why. The reporting system should immediately help narrow the issue: Did traffic fall? Did paid spend drop? Did the conversion rate weaken? Did a product go out of stock? Did discounting compress margin? Did repeat orders slow?
How iSight helps:
NetSights iSight analyses your Shopify store, ad accounts, and customer data together & then helps explain what is happening and what action to consider next. Less guesswork. More clarity.
An action-first analytics system does not ask the team to interpret everything from scratch. It provides a clear structure: what is the current state of business health, what changed, what caused it, and what decision should follow.
In practice, that looks like this:
Most dashboards stop at the headline. Revenue dropped. ROAS improved. Traffic is up.
That is the beginning of the question, not the answer.
An action-first system goes further. It tells you whether revenue dropped because sessions fell or conversion rate weakened or a key product went out of stock. It tells you whether improving ROAS came with healthier margins or just better-looking platform numbers. It tells you whether traffic growth actually moved the business or only moved the session counter.
Teams do not need more isolated metrics. They need connected signals that lead to confident action.
How Netification helps:
Instead of waiting for someone to open a dashboard, Netification sends important ecommerce KPI updates through WhatsApp, Slack, or email the moment something worth acting on happens.
How Netty helps:
Netty is NetSights’ conversational AI layer. It helps founders and growth teams get fast answers to business questions without manually scanning reports or switching between tools
Good analytics should make your next team meeting shorter, not longer.
NetSights is built around a straightforward idea: ecommerce founders and growth teams do not need more dashboards. They need clearer decisions.
In a typical ecommerce operation, important business signals sit across Shopify, Meta Ads, Google Ads, GA4, Search Console, CRM tools, email platforms, WhatsApp, and finance sheets. Teams spend significant time collecting and comparing data across these tools before they can even understand what is happening, let alone decide what to do.
NetSights connects these signals into one decision-ready system. The purpose is not to display all data in one screen. The purpose is to help teams understand what changed, why it matters, and where action is needed without manual reconciliation.
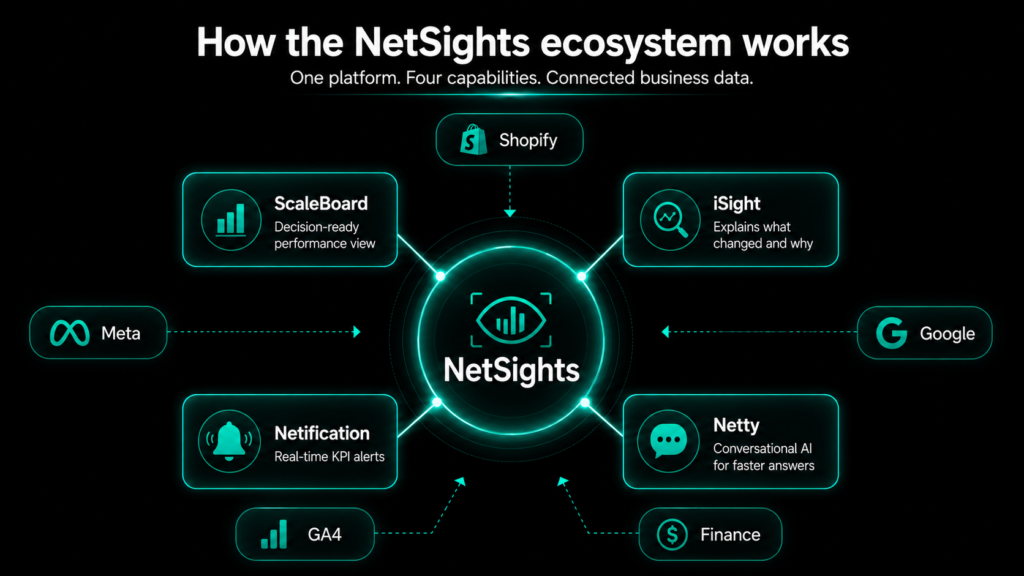
For ecommerce teams, this directly reduces decision fatigue by:
This does not eliminate the need for judgment. Good business decisions still require human thinking. But judgment works better when data is clear, connected, and trusted.
Ready to reduce decision fatigue in your ecommerce team?
Connect Shopify, Meta, Google, and finance data into one decision-ready system.
These patterns are easy to normalise. But they almost always point to a deeper reporting problem.
Meetings start with data clarification instead of decision-making. The first 20 minutes go to agreeing on which number is correct before the actual discussion begins.
Slow action on obvious problems. A campaign continues spending even when profitability is clearly weak. A product sits under-promoted even though demand data is available. A landing page issue surfaces after revenue has already dropped.
The fix is not to remove data. The fix is to make data easier to trust and easier to act on.
Every important KPI should have a clear owner and a clear, documented definition. If no one owns a metric, no one protects its quality. Ownership prevents the drift that leads to five different versions of the same number.
Different teams can have their own operational views. But leadership decisions should come from one trusted source. Consolidate the reports that inform strategy.
Not every metric needs daily attention. Some metrics should trigger immediate alerts. Some should be reviewed weekly. Some are diagnostic tools used only when a problem is already identified. Build this priority structure explicitly.
Every core metric should map to a business decision. ROAS connects to spend decisions. CAC connects to acquisition strategy. Contribution margin connects to product and pricing choices. Repeat purchase rate connects to retention investment. Inventory signals connect to promotion planning.
Teams should not spend hours building reports that a system can generate. Their time should go into interpretation, planning, and action. Automation of recurring reporting is not a luxury. It is how teams reclaim decision-making capacity.
When teams have clearer reporting, they can test changes with more confidence and speed.
Related read: A/B Testing Framework for Ecommerce ROAS
Use this as a quick diagnostic for your current reporting setup.
Area | Bad Analytics | Decision-Ready Reporting (NetSights) |
Data sources | Scattered across 8–10 tools | Connected into one trusted view |
Metrics | Too many KPIs, no priority | Focused KPIs linked to decisions |
Data quality | Inconsistent, definitions unclear | Defined, checked, and trusted |
Team meetings | Time spent explaining numbers | Time spent choosing next actions |
Dashboards | Passive charts and filters | Clear signals with next-step context |
Reporting work | Manual exports and spreadsheets | Automated, structured, and fast |
Decision speed | Slow and uncertain | Faster and more confident |
Team impact | Confusion, follow-ups, wasted cycles | Better focus and execution |
Decision fatigue in business is not caused by data itself. It is caused by bad analytics, scattered reports, poor data quality, and dashboards that generate more questions than answers.
When teams spend too much time finding, checking, and debating numbers, they have less energy for the decisions that actually move the business forward. The cost is not only time. It is missed opportunities, slow responses, wrong bets, and a team that gradually loses confidence in its own data.
Better analytics changes that. Not by adding more dashboards, but by reducing the gap between data and decision. By helping teams understand what changed, why it matters, and what to do next. By making reporting clearer, meetings shorter, and action faster.
For ecommerce and D2C teams, NetSights is built to make that shift possible.
Stop spending half your day on reports. Start making faster decisions.
See what NetSights does for ecommerce teams like yours.
A: Decision fatigue in business is the mental drain that builds when teams repeatedly process unclear, conflicting, or incomplete data before they can make a confident decision. In ecommerce, it typically shows up as delayed campaign actions, circular reporting meetings, and low confidence in analytics.
A: Analytics cause decision fatigue when they require teams to manually reconcile data from multiple disconnected tools, interpret conflicting numbers, and connect metrics without clear context. When a team spends more time understanding reports than acting on them, the analytics system is creating the problem.
A: Too many reports slow business teams because each report adds another layer of interpretation before anyone can act. When different teams use different definitions or dashboards, meetings shift from decision-making to data clarification, which delays action and reduces confidence.
A: Bad data reduces trust, increases manual verification work, and delays decisions. Teams may spend more time checking numbers than acting on insights. Poor data quality leads to wrong budget allocation, missed growth opportunities, repeated reporting work, and low team confidence.
A: Businesses reduce analytics overload by consolidating key data sources, defining shared KPIs with clear ownership, removing unused reports, automating recurring reporting, and focusing dashboards on action-ready signals. The goal is to answer three questions fast: what changed, why it happened, and what to do next.
A: A dashboard displays data. Decision intelligence helps teams understand the meaning behind the data and what action to take. For growing ecommerce businesses, the difference matters because teams do not only need numbers. They need context, clear signals, and a path to the next decision.
A: Ecommerce teams streamline reporting by connecting Shopify, Meta Ads, Google Ads, GA4, retention, and finance data into one trusted view, defining core metrics clearly, removing duplicate reports, assigning metric ownership, and using automation to eliminate manual reporting work.
A: NetSights reduces decision fatigue by bringing scattered ecommerce data into a decision-ready system. Instead of forcing teams to move across multiple tools and reconcile conflicting reports, it highlights key business signals and explains what they mean so founders and growth teams can act faster with more confidence.
We write about growth, retention, and the numbers that actually predict what happens next for D2C brands. Have a topic you'd like us to cover? Get in touch .
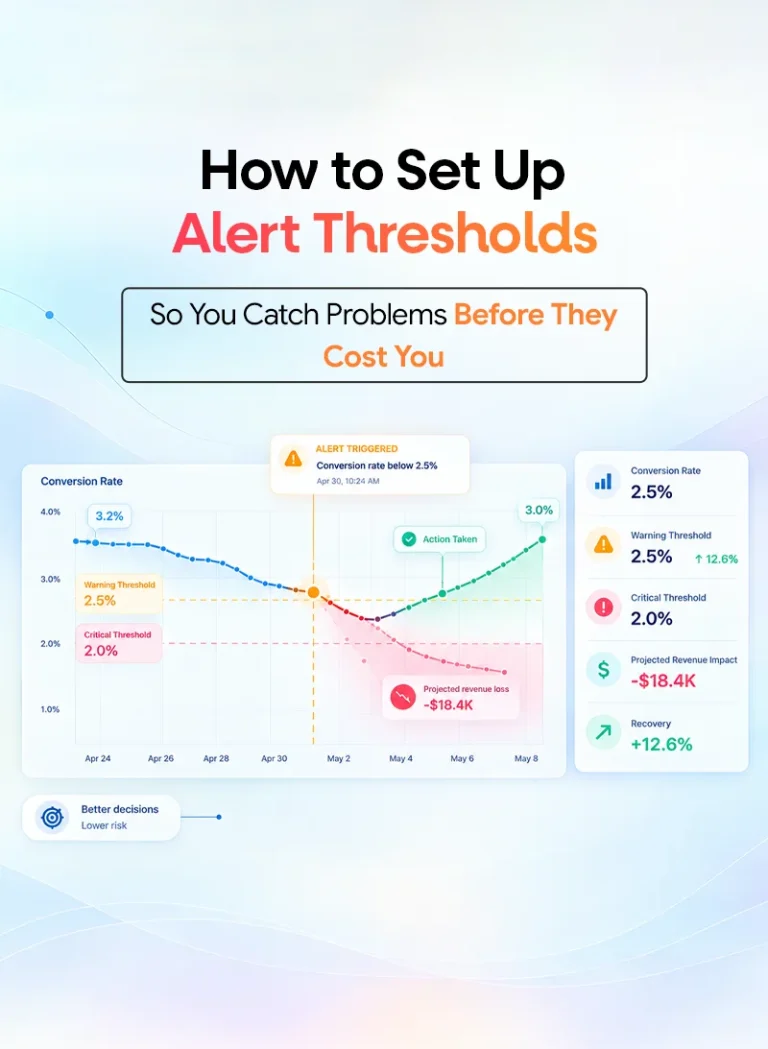
Your ecommerce store already contains the answers. Learn how AI ecommerce analytics helps founders ask business questions, understand what changed and why, and move from scattered data to clearer decisions.
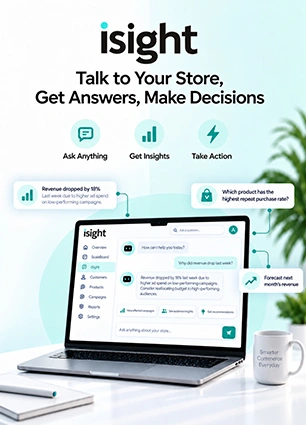
Your ecommerce store already contains the answers. Learn how AI ecommerce analytics helps founders ask business questions, understand what changed and why, and move from scattered data to clearer decisions.
Compare Shopify conversion rate benchmarks by industry, device, traffic source, and customer type. See what a good conversion rate looks like in 2026 and learn how to benchmark your store more accurately.