
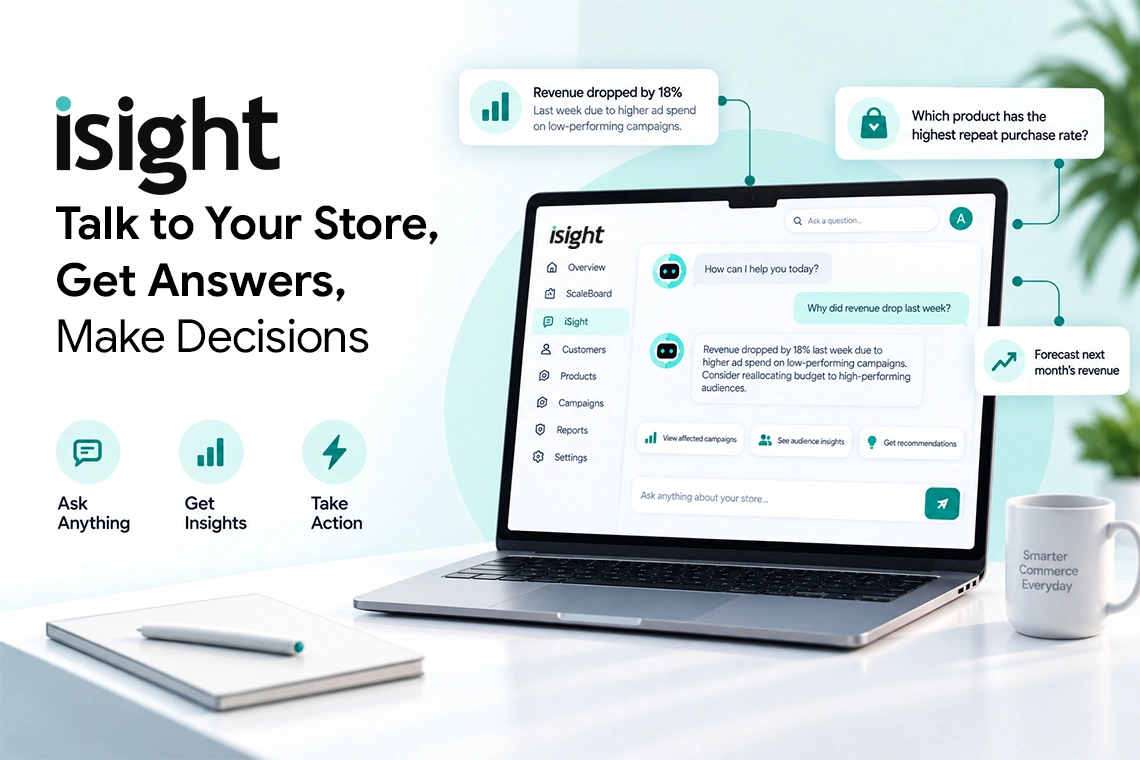
Your ecommerce store already knows a lot about your business.
It knows what sold yesterday, which campaigns brought customers in, where conversion started falling, which products are gaining momentum, how acquisition costs are changing and whether returning customers are spending more or less.
The problem is not a lack of data.
The problem is that the answers are spread across Shopify, Meta Ads, Google Ads, GA4 and other platforms.
So when a founder asks:
“Why did revenue drop yesterday?”
The answer often requires opening several dashboards, comparing reports and interpreting how different metrics relate to one another.
AI ecommerce analytics changes that experience.
Instead of only reading reports, founders can start asking questions.
Ask. Get an answer. Understand what changed. Make a decision.
That is the idea behind iSight.
AI ecommerce analytics uses artificial intelligence to analyse ecommerce data, identify patterns, detect anomalies, connect related metrics and turn raw information into insights that support business decisions.
IBM defines AI analytics as the application of artificial intelligence, including machine learning and natural language processing, to process data and generate predictions or recommendations.
In ecommerce, this matters because no single platform contains the full picture.
Shopify can provide data on sales, orders, products and customers. GA4 adds website behaviour and acquisition data. Meta Ads and Google Ads provide another view of paid performance. CRM and retention platforms add customer behaviour, while inventory systems add stock availability.
Each platform explains one part of the business.
The real challenge is understanding what those signals mean together.
That is where AI-powered ecommerce analytics can help.
Shopify Analytics gives merchants dashboards and reports for analysing store activity, visitors, web performance and transactions.
Suppose revenue falls by 12%.
You can immediately see that performance has changed.
But the number does not explain why.
A founder may need to investigate:
The data may already exist.
The difficult part is connecting it.
This is where traditional ecommerce reporting often becomes time-consuming. A founder can see what happened but still needs to work out why it happened.
We explored this problem in more detail in our guide to what founders can miss when relying only on Shopify Analytics.
Talking to your store does not literally mean Shopify becomes a chatbot.
It means changing how you interact with ecommerce data.
Traditional reporting usually follows this path:
Open dashboard → Find metric → Compare period → Check another platform → Interpret changes → Decide
Conversational analytics changes the starting point:
Ask a business question → Analyse relevant data → Understand the answer → Decide what to do
A founder might ask:
These are not just reporting questions.
They are decision-making questions.
The business workflow can be understood in four stages.
The founder starts with natural language.
For example:
“Why did CAC increase this week?”
They do not need to know which report or filter contains the answer.
The system identifies the signals related to the question.
That could include:
A useful system should not stop at the metric.
A weak answer would be:
“CAC increased by 18%.”
A stronger answer would be:
“CAC increased by 18% because paid media spend grew faster than new-customer orders, while store conversion also declined.”
The second answer provides context.
The analysis should narrow the action.
That may mean:
The value lies in moving from data to action faster.
See how quickly your ecommerce data can turn into answers.
Once analytics becomes conversational, founders can ask questions across multiple areas of the business.
|
Business Area |
Example Question |
|
Revenue |
Why is today’s revenue below target? |
|
Acquisition |
Why has CAC increased this week? |
|
Advertising |
Which campaign is hurting blended ROAS? |
|
Conversion |
Why did the conversion rate fall yesterday? |
|
Products |
Which products are gaining momentum? |
|
Inventory |
Which SKU is at risk of stockout? |
|
Retention |
Are returning customers spending more this month? |
|
Profitability |
Is revenue growth improving contribution margin? |
|
Forecasting |
Are we likely to hit our monthly target? |
|
Budget |
Where can we shift spend without increasing CAC? |
A performance marketer may ask:
“Did CPC increase?”
A founder is more likely to ask:
“Did the increase in CPC materially affect CAC, margin and overall growth?”
That second question requires context across multiple metrics.
Our guide to the weekly ecommerce metrics founders should review covers this distinction in more detail.
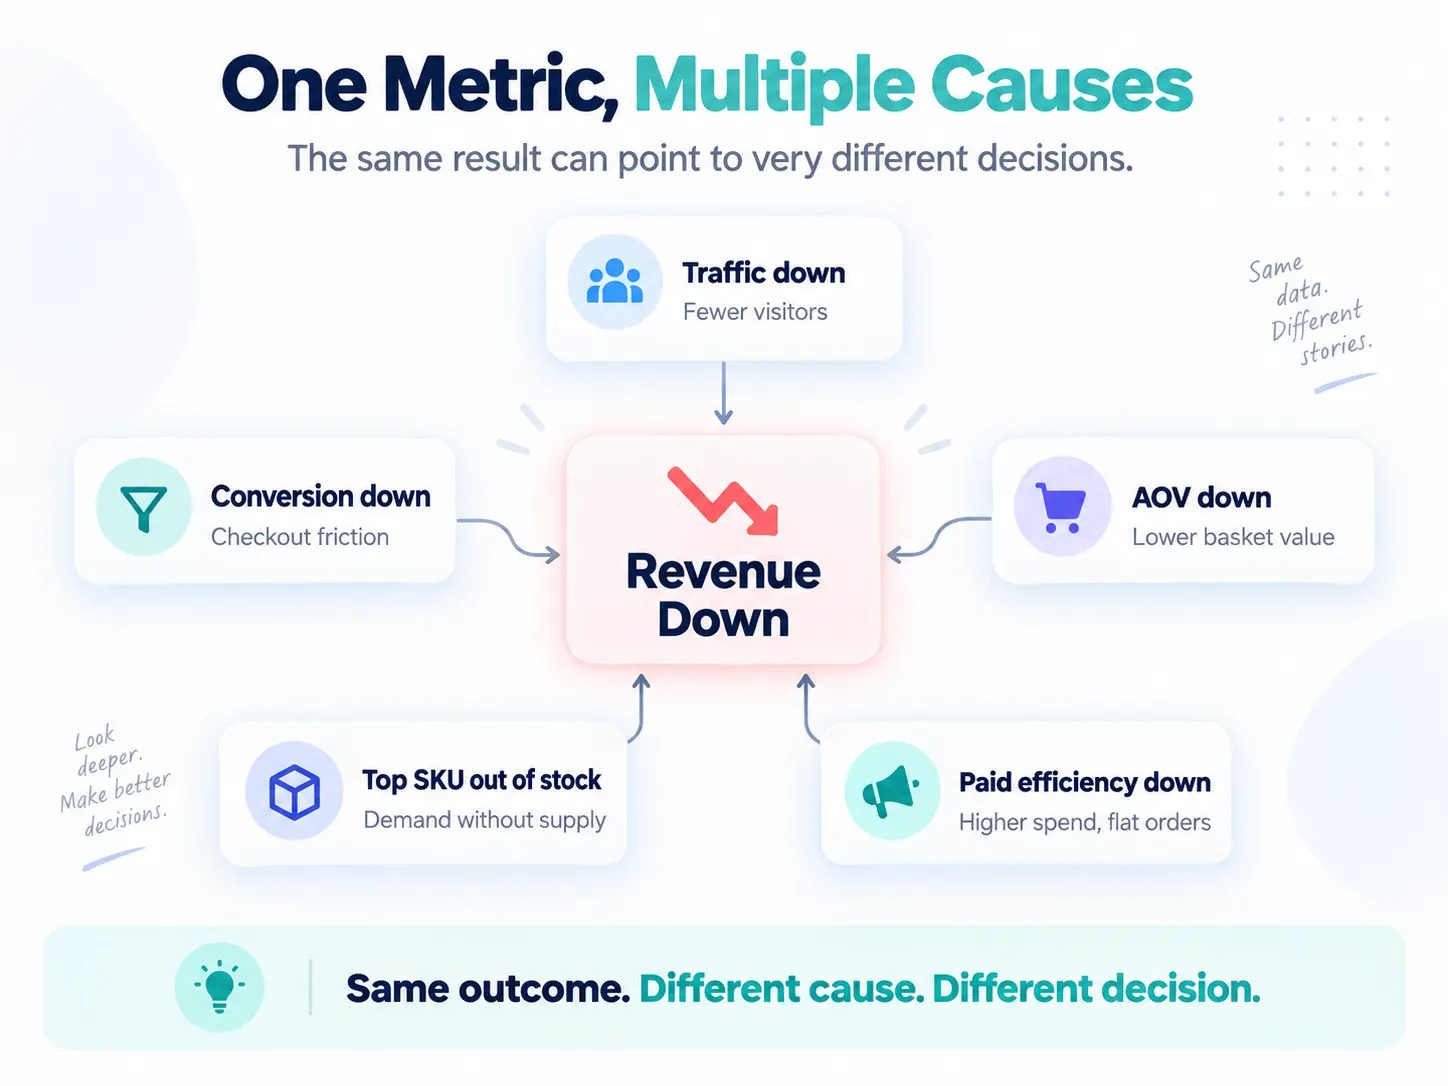
A single performance change can have many explanations.
Take ROAS.
Suppose ROAS falls from 3.4x to 2.5x.
The immediate reaction may be:
Reduce ad spend.
But that may not be the correct decision.
CPM and CPC may have risen while conversion stayed stable.
The problem may sit primarily in acquisition.
The campaign may not be the problem.
The decline could come from:
Revenue may fall even if traffic and advertising performance remain healthy.
Reducing spend across every campaign could make the situation worse.
A channel may look efficient inside the platform while overall acquisition economics are weakening.
The visible metric is the same.
The right decision depends on the cause.
Shopify defines checkout conversion rate as completed purchase sessions divided by sessions that reached checkout.
Baymard’s long-running ecommerce research puts average cart abandonment at about 70%. That makes checkout friction an important area to investigate when checkout starts are healthy but purchases are weak.
Shopify can also report how often a product is purchased relative to its product views.
This helps you find products that attract traffic but fail to convert, as well as products that may deserve more visibility.
Revenue is a good example of why connected analysis matters.
Suppose daily revenue falls from $25,000 to $20,500.
That is an 18% decline.
A dashboard tells you the result.
The founder still needs the diagnosis.
Imagine the data shows:
Now the picture is clearer.
The revenue drop may not be caused by traffic or advertising volume at all.
The founder may need to prioritise:
This is the difference between reporting and decision intelligence.
“Revenue is down 18%” is reporting.
“Revenue is down 18%, mainly due to weaker mobile conversion and a stockout on a high-revenue SKU” is closer to an answer.
Stop guessing what changed. Ask your data instead
Google Ads conversion measurement can help advertisers identify which campaigns, ads and keywords are driving valuable customer actions.
Suppose CAC rises from $42 to $51.
The obvious assumption is that advertising performance has worsened.
But CAC can increase because:
Each cause requires a different response.
Rising CPM may point to stronger audience competition or creative fatigue.
Healthy click performance combined with falling conversion can indicate that the real issue lies on the website.
When spend grows faster than new-customer orders, the business may be scaling beyond its current efficiency point.
AI ecommerce analytics becomes valuable when it can move the founder from:
“CAC is high”
to:
“CAC is high because of these specific changes.”
The usefulness of an insight depends partly on when you receive it.
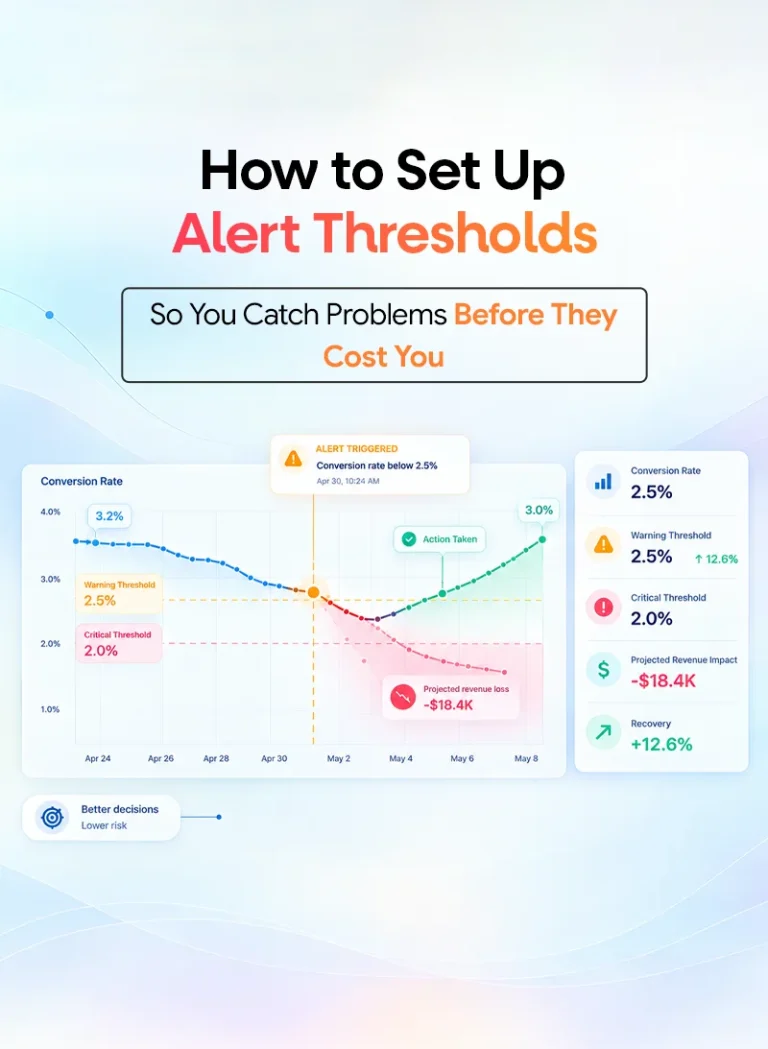
If conversion begins falling on Tuesday but the team notices it during a Friday or Monday review, several days of revenue may already have been affected.
Some ecommerce metrics can move quickly:
Other metrics need longer timeframes:
A useful analytics system should understand this difference.
The goal is not to react to every small fluctuation.
The goal is to shorten the cycle between:
Performance change → Detection → Investigation → Decision → Action
That is also why real-time ecommerce analytics and alerts can complement weekly reporting.
Marketing and inventory decisions are often treated separately.
They should not be.
Suppose Campaign A is delivering excellent ROAS.
The natural recommendation is:
Scale the campaign.
But the product receiving most of that demand has four days of stock left and the next replenishment is expected in ten days.
Scaling spend may improve short-term advertising metrics while creating a stockout that limits future revenue.
A better question is:
“Can we afford to scale this campaign based on current inventory?”
Advertising data says:
Scale.
Inventory data says:
Be careful.
A useful decision intelligence system needs both perspectives.
Many founder decisions are about what has not happened yet.
A dashboard tells you:
Revenue so far: $620,000
A forecast asks:
“Where are we likely to finish the month?”
Forecasting can help founders identify whether current performance is moving towards or away from target.
The analysis may consider:
Forecasts are not guarantees.
They are decision-support signals.
Their value lies in spotting risk early enough to change the outcome.
Dashboards remain useful.
They provide visibility, exploration and reporting.
Conversational analytics adds another layer: interpretation.
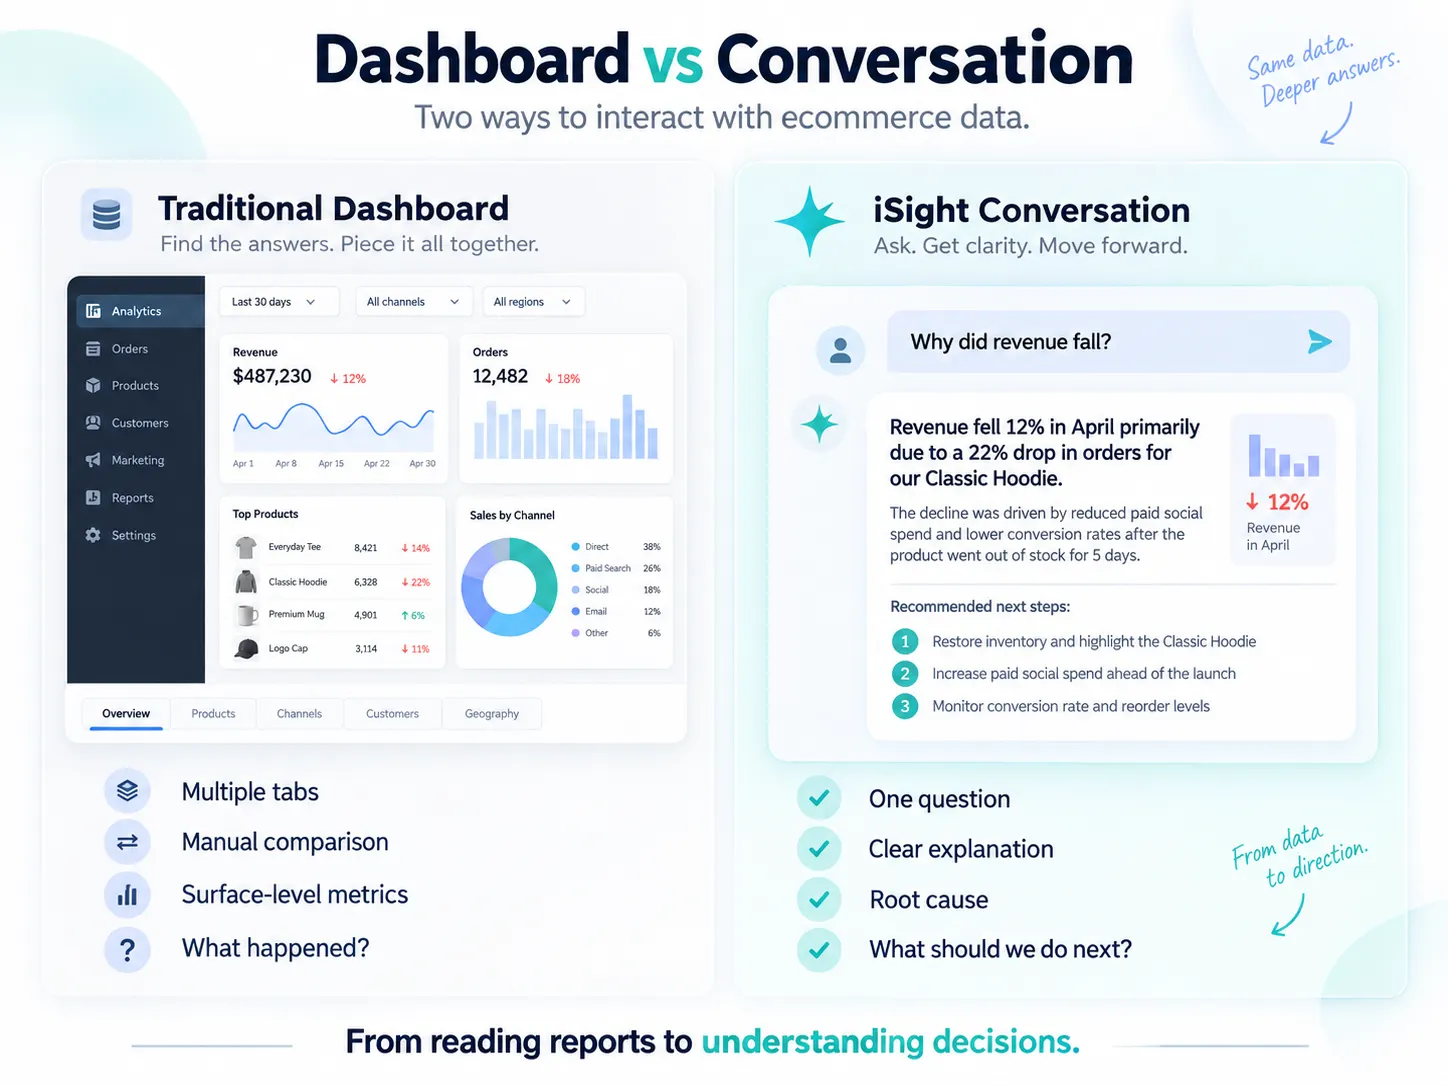
A dashboard might show:
Revenue: -11%
A decision-focused system should help answer:
Why is revenue down 11%, what else changed and what should we investigate first?
Our comparison of traditional ecommerce dashboards and decision-ready analytics explores this distinction further.
A growing ecommerce brand may use separate tools for:
Each platform may show accurate information.
The difficulty comes when leadership has to combine those views.
Marketing may say ROAS is strong.
Finance may say contribution margin is weakening.
Shopify revenue may be stable.
CAC may still be rising.
Nobody is necessarily wrong.
They are looking at different parts of the same business.
This creates decision fatigue because teams spend time reconciling reports instead of deciding what to do.
We discuss this issue in more depth in our guide to decision fatigue caused by fragmented analytics.
A useful system should provide five things.
Identify the performance movement.
Example:
Revenue declined 11%.
Not every fluctuation deserves attention.
The system should compare the change against relevant baselines and historical patterns.
Connect the signals that may be contributing to the movement.
Explain why the change matters.
For example, is it affecting revenue, margin, customer acquisition or future inventory?
The answer should narrow the next action.
This creates a more useful sequence:
Signal → Context → Cause → Impact → Next step
Move from scattered metrics to decision-ready insights.
No.
AI can help process data, identify patterns and surface relevant information quickly.
It does not automatically know every part of the business context.
A system may identify that a campaign is underperforming, while the marketing team knows new creative launches tomorrow.
It may detect low inventory, while operations know replenishment has already arrived.
It may forecast that revenue will miss target, while the founder knows a major launch is planned next week.
Human judgement remains essential for:
The strongest role for AI is decision support, not blind decision automation.
McKinsey’s State of AI research found that more than three-quarters of surveyed organisations were already using AI in at least one business function, showing how quickly AI is moving into everyday business workflows.
iSight is designed around this shift from reading dashboards to understanding what the data means.
It brings together ecommerce and performance signals and uses AI to help identify changes, investigate possible causes, forecast outcomes and support next-step decisions.
Its role can be simplified into four stages:
Bring together relevant ecommerce and marketing data.
Evaluate trends, anomalies and relationships across metrics.
Translate the findings into language a founder can understand.
Give teams clearer information for the next action.
The aim is not to replace Shopify, Meta Ads, Google Ads or GA4.
Those platforms remain important sources of data.
iSight is designed to help answer the question those systems may not answer together:
“What does all of this mean for the business?”
This approach is part of the wider Netsights ecommerce intelligence platform.
Ask your store what happened, why it happened and what to check next.
Ecommerce businesses will continue using specialist tools.
Shopify will manage commerce.
Advertising platforms will manage paid acquisition.
GA4 will provide behavioural analytics.
CRM systems will manage customer relationships.
Inventory systems will manage stock.
The challenge is that founder decisions cut across all of them.
A founder does not think in software categories.
They think in questions:
The next evolution of ecommerce analytics is not simply another dashboard.
It is making existing data easier to question, interpret and act on.
Ecommerce reporting has become very good at showing what happened.
The next challenge is shortening the distance between a metric and a decision.
Founders should not need to become analysts every time revenue falls.
Growth teams should not need to rebuild cross-platform reports every time CAC increases.
Marketing teams should not scale a strong campaign without knowing whether inventory can support demand.
The questions that matter are:
That is where AI ecommerce analytics becomes useful.
Your store already contains the signals.
The goal is to make those signals easier to understand.
Talk to your store. Get answers. Make decisions.
Explore iSight to see how AI-powered ecommerce intelligence can help turn performance data into clearer answers, or contact the Netsights team to discuss how it can fit into your decision-making workflow.
A: AI ecommerce analytics uses artificial intelligence to analyse ecommerce, marketing, customer and operational data. It can identify patterns, detect unusual changes, connect related metrics and help businesses understand what is happening and why.
A: A dashboard primarily displays metrics and visualisations. AI ecommerce analytics can add interpretation by connecting data, analysing changes and helping explain possible causes and next steps.
A: Yes. AI systems can analyse Shopify data such as orders, revenue, customers and products when the required data is properly connected. Combining Shopify with advertising, analytics and inventory data can provide additional context.
A: AI can help investigate possible causes by comparing revenue with traffic, conversion rate, AOV, advertising performance, customer behaviour and product availability. The quality of the answer depends on the completeness and accuracy of the connected data.
A: Founders can ask questions about revenue, CAC, ROAS, conversion, product performance, inventory, retention and forecasting. Examples include “Why did revenue fall?”, “Which campaign is increasing CAC?” and “Are we on track to hit the target?”
A: No. AI is better used as a decision-support layer. It can surface patterns and insights quickly, while founders and teams still apply strategy, commercial context and judgement before taking action.
We write about growth, retention, and the numbers that actually predict what happens next for D2C brands. Have a topic you'd like us to cover? Get in touch .
Your ecommerce store already contains the answers. Learn how AI ecommerce analytics helps founders ask business questions, understand what changed and why, and move from scattered data to clearer decisions.
Compare Shopify conversion rate benchmarks by industry, device, traffic source, and customer type. See what a good conversion rate looks like in 2026 and learn how to benchmark your store more accurately.
Compare Shopify conversion rate benchmarks by industry, device, traffic source, and customer type. See what a good conversion rate looks like in 2026 and learn how to benchmark your store more accurately.