
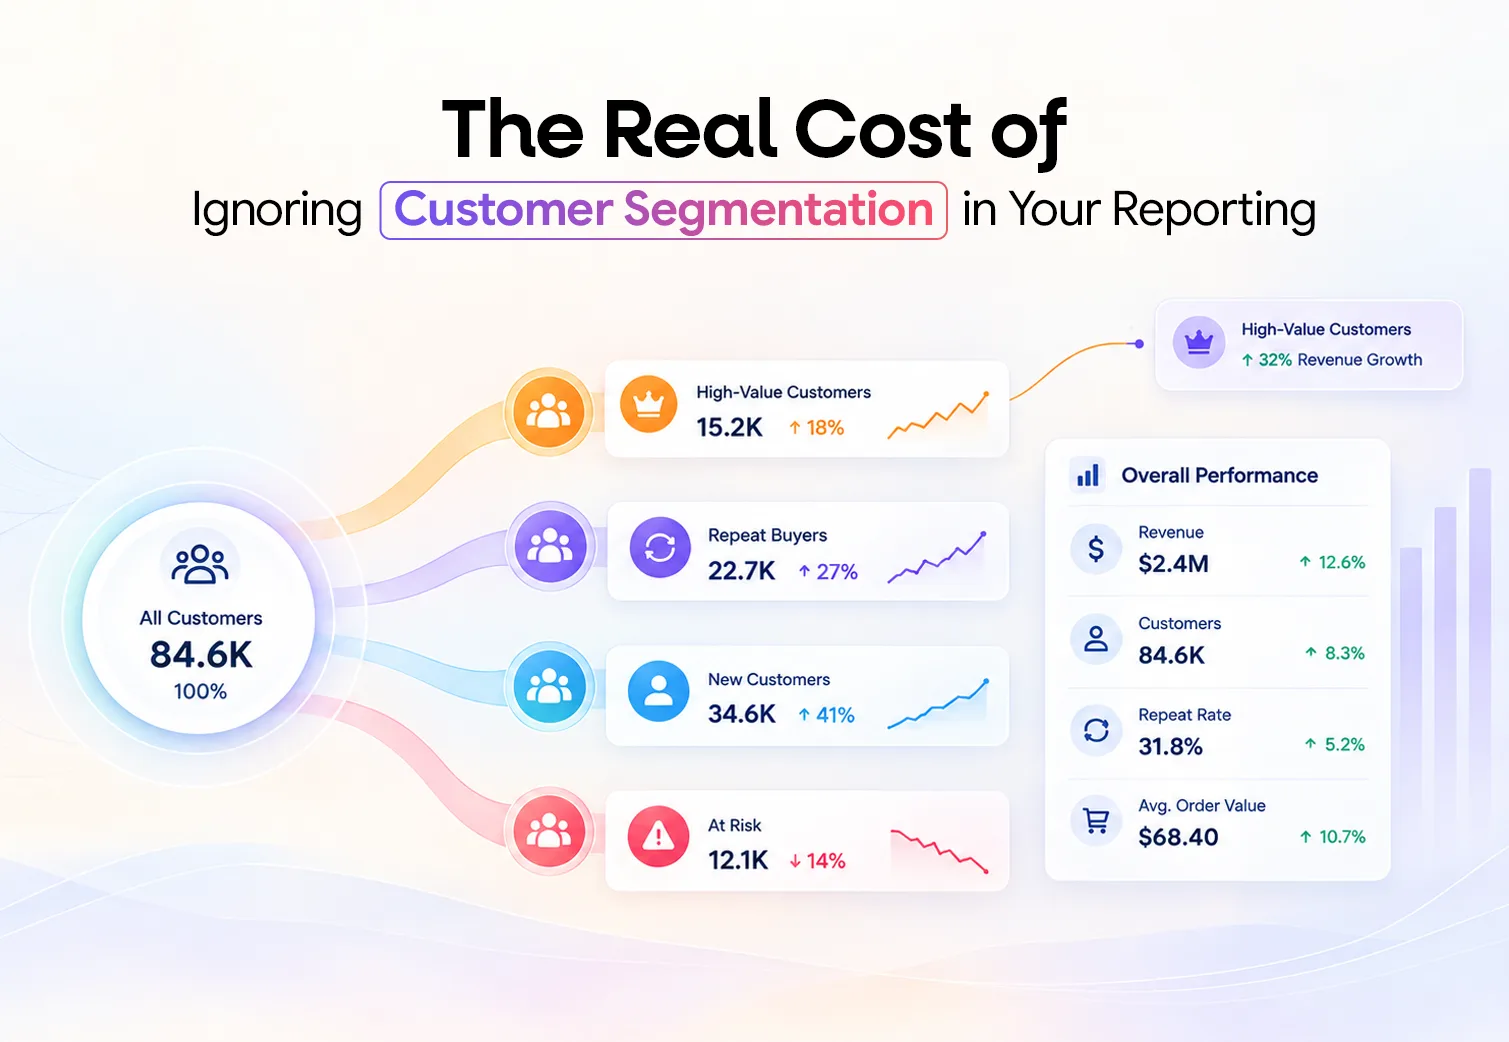
Your ecommerce report can be completely accurate and still lead you to the wrong conclusion. Customer segmentation reveals the changes that storewide averages often hide.
Revenue is up 12%.
ROAS looks healthy.
Conversion rate has barely changed.
Your weekly report suggests the business is moving in the right direction.
But underneath those numbers, repeat-customer revenue could be falling. Your VIP customers might be ordering less often. New customers may be getting more expensive to acquire. Discount-led buyers could be driving a growing share of sales.
The report is not wrong.
It is simply showing you the average.
That is where customer segmentation changes the picture. Instead of treating every customer as one group, it helps you understand which customers are actually driving growth, which ones are becoming less valuable, and where action may be needed.
Customer segmentation helps ecommerce teams understand which customer groups are driving changes in revenue, conversion, retention, CAC, and customer lifetime value.
Without segmented reporting, a healthy storewide average can hide falling repeat purchases, weaker VIP activity, poor acquisition quality, rising discount dependence, or customers who are at risk of leaving.
The value is not simply having more customer groups.
It is being able to answer better business questions.
Customer segmentation is the process of dividing customers into smaller groups based on characteristics or behaviours they share.
For an ecommerce business, those characteristics might include purchase history, order frequency, average spend, products purchased, engagement, location, or time since the last order.
Shopify describes ecommerce customer segmentation as grouping people based on shared qualities and using those groups across personalisation, advertising, loyalty, merchandising, and reporting.
That last use case matters.
Segmentation is often discussed as a marketing tactic, but it is also an important part of customer analytics and reporting.
If 50,000 customers are treated as one group, the resulting averages can hide major differences in how those customers behave.
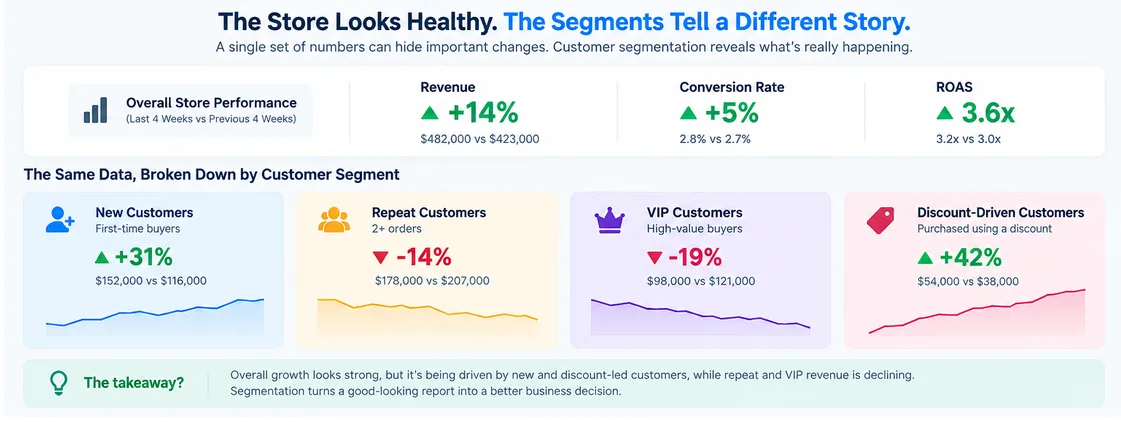
Consider a store that reports this:
Everything appears healthy.
Now break the same business down by customer segment:
|
Customer Segment |
Revenue Change |
What It Suggests |
|
New customers |
+31% |
Acquisition is driving growth |
|
Repeat customers |
-14% |
Retention is weakening |
|
VIP customers |
-19% |
High-value revenue may be at risk |
|
Discount-driven customers |
+42% |
Growth is becoming more promotion-dependent |
The topline report says:
Growth is strong.
The segmented report says:
Growth is strong, but its quality may be changing.
That is a very different business conversation.
This is why reporting should help teams understand relationships between metrics instead of simply presenting more numbers. The same principle sits at the heart of ecommerce decision intelligence.
The cost of poor segmentation rarely appears as one obvious line in a P&L.
Instead, it appears through missed signals and weaker decisions.
A brand can keep growing revenue while losing repeat customers.
Paid acquisition may bring enough first-time buyers to hide the decline for months.
For example:
The final number looks good.
But the business now needs more acquisition just to maintain the same growth rate.
This is why customer retention and acquisition should be analysed together.
Suppose your average CAC is $38.
That number tells you what a customer costs to acquire.
It does not tell you what kind of customer you acquired.
One group might cost $50 to acquire but purchase four times over the next year. Another might cost $25 and never return.
The cheaper acquisition is not automatically the better investment.
Segmenting acquisition data by customer value makes the relationship between CAC and customer lifetime value much clearer.
VIP customers may represent a small share of total buyers while contributing a much larger share of revenue.
If their purchase frequency starts falling, the overall repeat-purchase rate may barely move.
That does not mean the change is unimportant.
Shopify’s customer reporting and RFM analysis includes views for new versus returning customers, predicted spend tiers, cohorts, and RFM groups.
These views make it possible to go beyond total customer counts and look at customer quality and behaviour.
Imagine two email campaigns.
|
Campaign |
Conversion Rate |
What Happened |
|
Campaign A |
4.8% |
Mostly loyal customers purchased again |
|
Campaign B |
3.0% |
Brought hundreds of lapsed customers back |
Which campaign performed better?
Campaign A won on conversion rate.
Campaign B may have created more incremental value.
Without audience segmentation, teams can reward the easiest conversions rather than the outcomes that matter most.
According to Klaviyo’s segmentation guidance, highly segmented campaigns generate more than three times the revenue per recipient of unsegmented campaigns on its platform. This does not guarantee the same result for every brand, but it shows how strongly audience context can affect campaign economics.
Customer segmentation can become complicated very quickly.
Most D2C brands do not need dozens of customer groups to improve reporting.
A practical starting point is:
|
Customer Segment |
Metrics to Watch |
Main Question |
|
New customers |
CAC, first-order AOV, conversion |
Are we acquiring valuable customers? |
|
Repeat customers |
Repeat rate, revenue, order frequency |
Are customers coming back? |
|
VIP customers |
CLV, revenue, purchase frequency |
Are our best customers staying active? |
|
At-risk customers |
Time since last purchase, CLV |
Which valuable customers may leave? |
|
Lapsed customers |
Previous spend, inactivity period |
Who may be worth reactivating? |
These segments are simple enough to understand and broad enough to answer important growth questions.
More detailed segments can be added when there is a clear reason to use them.
There are many types of customer segmentation, but not all of them provide the same value for ecommerce reporting.
Behavioral segmentation groups customers based on what they actually do.
This might include purchase frequency, products purchased, discount use, browsing behaviour, email engagement, returns, or time since their last order.
For ecommerce teams, this is often more useful than relying only on demographic information because it reflects real buying behaviour.
Shopify’s 2026 segmentation guide highlights purchase frequency, recency, AOV, category affinity, discount sensitivity, lifecycle stage, and channel engagement as behavioural data that can support segmentation.
Lifecycle segmentation looks at where someone sits in the customer relationship.
A simple journey might look like:
First-time buyer → Repeat buyer → Loyal customer → VIP → At risk → Lapsed
This makes customer reporting easier because teams can see how customers move from one stage to another.
For many D2C brands, getting customers from the first purchase to the second purchase is one of the most important transitions to track.
Value-based segmentation groups customers according to the economic value they create.
This might include high-CLV customers, high-AOV buyers, VIPs, high-return customers, low-margin customers, or discount-dependent shoppers.
Klaviyo, for example, allows eligible businesses to create segments using historic, predicted, and total customer lifetime value.
This helps teams move beyond:
“Who buys?”
towards:
“Which customers create the most long-term value?”
These three signals can create practical customer groups.
|
RFM Customer Type |
Typical Behaviour |
Possible Action |
|
Champions |
Recent, frequent, high-value purchases |
Reward and retain |
|
New customers |
Very recent purchase, low frequency |
Encourage a second order |
|
Active customers |
Recent with moderate spend |
Build frequency |
|
At-risk customers |
Previously valuable but becoming inactive |
Investigate and reactivate |
|
Dormant customers |
Low recent activity |
Test win-back potential |
Shopify now includes RFM customer analysis in its customer reports and lets merchants use RFM groups to create customer segments.
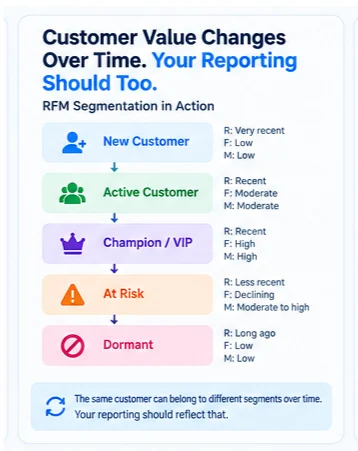
RFM is useful because it combines customer value with customer behaviour.
A customer who spent $500 last year but has not purchased in nine months should not necessarily be reported in the same way as someone who spent $500 last week.
The metric does not change.
Its meaning does.
|
KPI |
Storewide Question |
Better Segmented Question |
|
Revenue |
Did revenue increase? |
Which customers drove the increase? |
|
Conversion rate |
Did conversion improve? |
Which customer groups converted better? |
|
CAC |
What does a customer cost? |
What does a valuable customer cost? |
|
ROAS |
Which campaign generated revenue? |
Which customers did that campaign generate or reactivate? |
|
Repeat rate |
Are customers returning? |
Which cohorts and customer groups are returning? |
|
Refund rate |
Are returns increasing? |
Which customers, products, or campaigns drive them? |
|
CLV |
What is the average customer value? |
Which groups create the most long-term value? |
This is one reason weekly ecommerce metrics become much more useful when the segments behind the average are visible.
A useful segment should change what you do next.
Consider three simple examples.
Your total revenue is stable, but repeat-customer revenue falls 15%.
Instead of increasing acquisition spend immediately, the team can investigate order frequency, product mix, email engagement, customer satisfaction, or the second-purchase journey.
Meta CAC falls from $45 to $34.
That sounds positive.
But segmented reporting shows the campaign is bringing in more discount-driven customers with lower repeat rates.
The CAC improvement may therefore be less valuable than it first appears.
This is why segmentation should sit alongside marketing attribution when judging channel performance.
Overall revenue remains flat, but VIP revenue falls 18%.
That deserves attention even if the total customer base continues to grow.
The team can then investigate whether VIP customers are ordering less often, buying lower-value products, or becoming inactive.
These are decisions an overall revenue chart cannot support on its own.
Do not begin with:
“What segments can we create?”
Begin with:
“What decision are we trying to make?”
For example:
Why is repeat revenue falling?
That question tells you which customer groups and metrics you need.
A VIP customer should mean the same thing to marketing, ecommerce, CRM, and finance.
If one team defines VIP as $500 in lifetime spend while another uses five completed orders, reports will conflict.
Document the rules.
Useful segmentation may rely on data from Shopify, GA4, your CRM, email platform, advertising platforms, and other customer systems.
Google Analytics 4 audience tools also allow businesses to group users based on shared characteristics or behaviours for analysis and remarketing.
The goal is not to collect every possible data point.
It is to connect the data needed to answer the business question.
A number without comparison tells you very little.
Compare a segment with its previous period, historical baseline, store average, or another relevant customer group.
For example:
VIP revenue: $82,000
is less useful than:
VIP revenue: $82,000, down 17% from the previous four-week average.
Now there is a signal.
Teams should not need to manually check every segment every morning.
Important changes should be easy to spot.
For example:
Repeat-customer conversion down 14%
or:
VIP revenue down 18% from baseline
can matter even when overall revenue remains stable.
This is where real-time business reporting becomes more useful than waiting for a monthly report to reveal the problem.
Segmentation can create a new problem if every customer group becomes another report that someone has to check.
That is not the goal.
The better workflow is:
What changed? → Which customer segment changed? → Why did it change? → Does it need action?
NetSights brings ecommerce, marketing, and customer data together so teams can look at performance in business context rather than moving between disconnected reports.
iSight helps teams investigate important changes across business metrics and understand what may be driving them.
Instead of only seeing:
Revenue is down.
A more useful reporting layer could help you investigate:
Repeat-customer revenue is down, VIP purchase frequency has weakened, and the change started after a specific period.
That is much closer to a decision.
See which customer groups are changing and understand what deserves attention before the impact reaches your topline.
More segments do not mean better reporting.
A segment is useful when it helps answer a question or change an action.
If nobody knows what to do with it, it probably does not deserve a permanent place in the dashboard.
Customer segmentation should not end with email targeting.
Use it to understand acquisition quality, retention, CLV, profitability, product behaviour, refunds, and revenue quality.
Customer behaviour changes.
A first-time buyer becomes a repeat customer. A loyal customer can become at risk. A low-value buyer can become a VIP.
Shopify and Klaviyo both support dynamic customer segments whose membership changes as customers meet or stop meeting the defined rules.
Knowing that repeat customers generated $100,000 is useful.
Knowing that repeat-customer revenue fell 20% while new-customer revenue rose 35% is much more useful.
Context turns reporting into analysis.
Customer segmentation is not just about sending more personalised messages.
A better use of segmentation is understanding what is really happening across your ecommerce business.
Storewide metrics can show that revenue, conversion rate, CAC, ROAS, or retention has changed. Segmented reporting helps explain which customer groups are behind that change.
Growth may be coming from new customers while repeat buyers are slowing down. VIP customers may be becoming less active, or lower CAC may be bringing in customers with weaker long-term value. Discounts can also look successful at first while mainly driving one-time purchases.
Getting useful insight does not require dozens of customer segments.
Start with the groups that influence your biggest business decisions. Define them clearly, track the right metrics for each one, and compare how their behaviour changes over time.
The goal is not to create more reports.
What matters is making sure overall averages do not hide the customer trends that are shaping your business.
Your Shopify, marketing, and customer data already contains signals about who is buying, returning, spending more, or slipping away.
NetSights helps bring those signals together so you can understand important changes and make better decisions faster.
A: Customer segmentation is the process of grouping customers based on shared characteristics or behaviours. Ecommerce businesses may segment customers using purchase frequency, spending, lifecycle stage, engagement, location, product interest, or customer value.
A: Customer segmentation helps reveal differences hidden by storewide averages. For example, overall revenue may increase even when repeat-customer or VIP revenue is falling.
A: Common models include demographic, geographic, psychographic, behavioural, lifecycle, value-based, and RFM segmentation. Behavioural, lifecycle, and value-based models are often especially useful for ecommerce reporting.
A: RFM stands for recency, frequency, and monetary value. It groups customers based on how recently they purchased, how often they buy, and how much they spend.
A: A useful starting point is new customers, repeat customers, VIP customers, at-risk customers, and lapsed customers. Additional segments should be created when they support a clear business question.
A: Segmentation allows marketers to match campaigns and messages to customers with similar behaviours or needs. It can also help teams judge campaign performance by the type of customers a campaign reaches or converts.
A: Useful metrics include revenue, conversion rate, CAC, AOV, customer lifetime value, repeat purchase rate, purchase frequency, ROAS, refund rate, and contribution margin.
A: Customer segmentation usually focuses on known customers and customer data. Audience segmentation can also include prospects or website visitors who have not yet purchased.
We write about growth, retention, and the numbers that actually predict what happens next for D2C brands. Have a topic you'd like us to cover? Get in touch .
Your ecommerce store already contains the answers. Learn how AI ecommerce analytics helps founders ask business questions, understand what changed and why, and move from scattered data to clearer decisions.
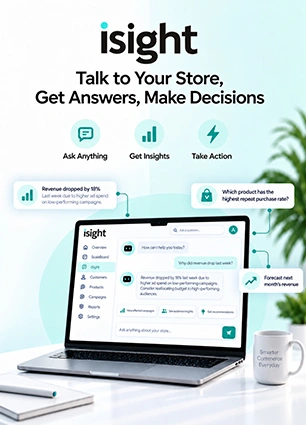
Your ecommerce store already contains the answers. Learn how AI ecommerce analytics helps founders ask business questions, understand what changed and why, and move from scattered data to clearer decisions.
Compare Shopify conversion rate benchmarks by industry, device, traffic source, and customer type. See what a good conversion rate looks like in 2026 and learn how to benchmark your store more accurately.