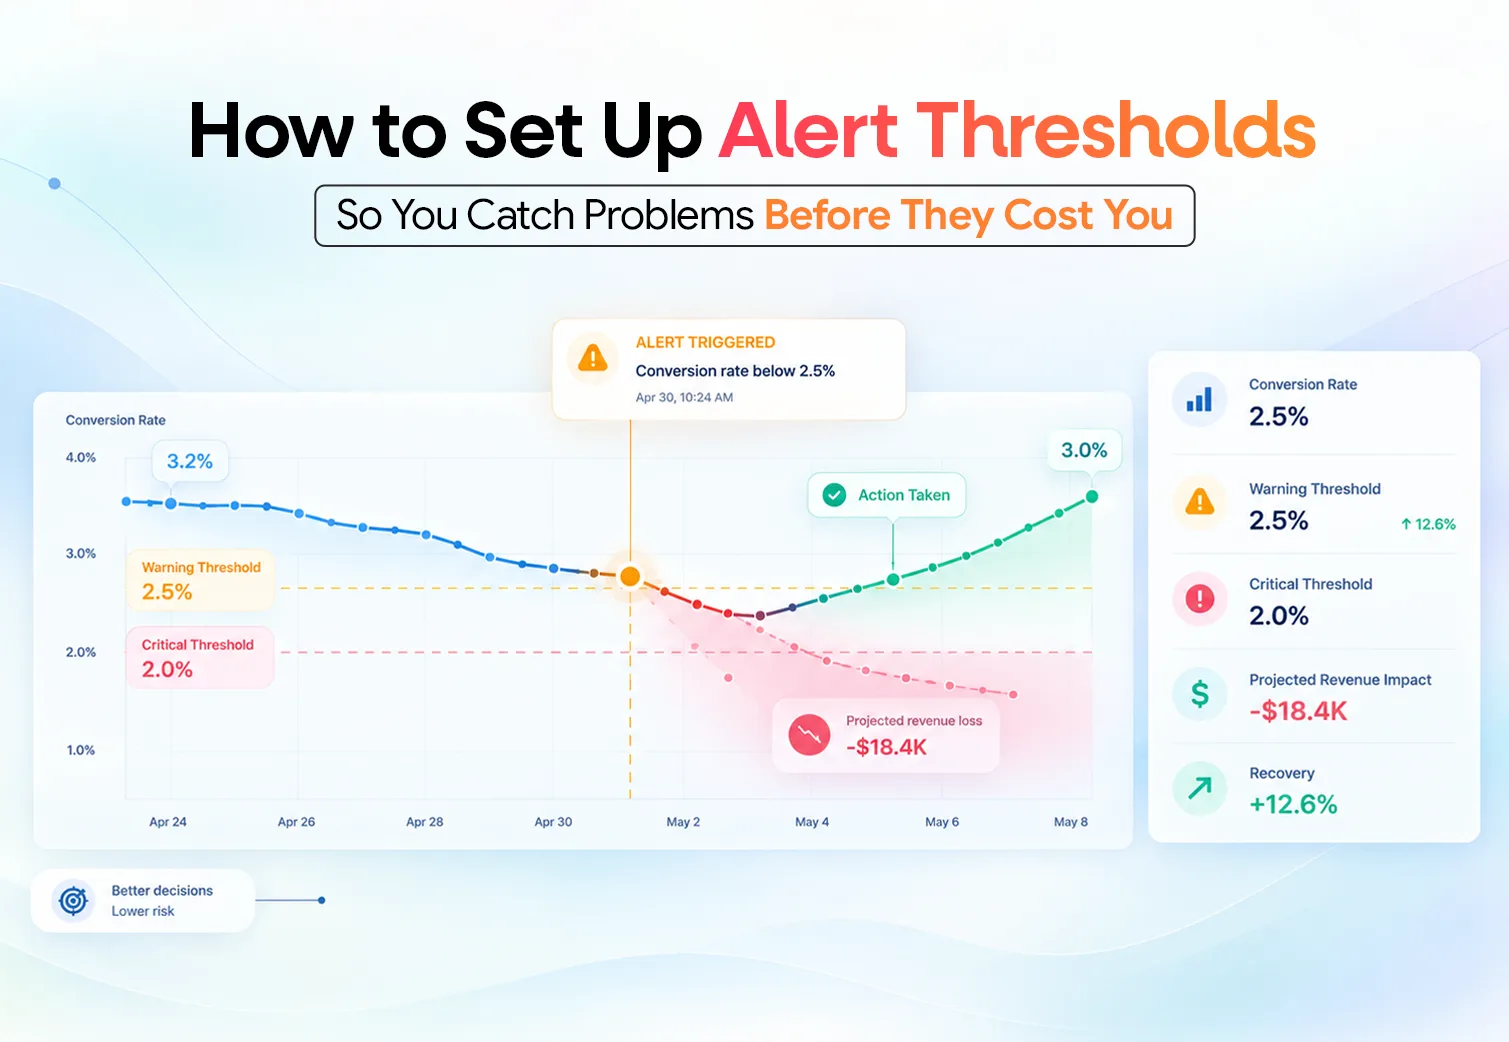
A KPI alert that fires too late is a post-mortem.
One that fires every few minutes eventually becomes background noise.
The useful alert sits somewhere between those extremes.
Imagine your ecommerce revenue normally fluctuates by 5% during the day. If an alert fires whenever revenue drops 3%, your team will eventually stop paying attention.
But if the threshold waits for a 30% decline, you may only discover the issue after hours of lost orders, wasted ad spend or a checkout problem that should have been caught much earlier.
Setting effective KPI alert thresholds is therefore not about picking a number that looks safe. It is about defining what normal looks like, how far performance can move before it matters, how much evidence you need, and who should act when the notification arrives.
The goal is simple:
Catch the problem while it is still a signal, not after it becomes a cost.
KPI Alert Thresholds Explained: What They Are and Why They Matter
A KPI alert threshold is a rule that determines when a business metric has moved far enough from normal or acceptable performance to require attention.
Strong thresholds usually combine four things:
- A relevant baseline
- A meaningful deviation
- Enough data to trust the change
- A persistence period that filters temporary noise
This matters because ecommerce performance rarely moves in straight lines.
Revenue changes throughout the day. Conversion varies by device and traffic source. CAC can rise as advertising scales. ROAS can look weak while conversions are still being attributed. Inventory naturally falls when demand increases.
Good KPI monitoring does not notify you every time something moves.
It identifies changes that are unusual, sustained or commercially important enough to investigate.
Why Poor KPI Thresholds Can Be Expensive
Bad thresholds usually create one of two problems.
1. False positives
The alert says something is wrong when performance is actually behaving normally.
Suppose Sunday conversion usually sits around 2.7%, while Tuesday conversion averages 3.6%.
A rule saying:
Alert when conversion falls below 3%
may trigger every Sunday.
After enough unnecessary notifications, the team stops trusting the system.
2. False negatives
A genuine problem occurs, but the alert never fires.
Tuesday conversion could fall from 3.6% to 3.1%. The fixed 3% threshold remains silent even though conversion has declined by almost 14%.
The real cost is not simply missing the signal.
It is the time between:
Problem starts → Problem gets noticed → Someone investigates → Action happens
For checkout failures, revenue declines, advertising inefficiency or inventory risk, every extra hour can carry a commercial cost.
This is why real-time business reporting should complement scheduled reporting rather than simply replicate it.
Define Normal Performance Before Setting Any KPI Alert Threshold
Every useful threshold needs a baseline.
The baseline is the reference used to decide whether current performance is normal.
Depending on the KPI, that might be:
- Previous day
- Previous week
- 7-day rolling average
- 28-day rolling average
- Same weekday and time period
- Business target
- Expected statistical range
The correct baseline depends on what you are monitoring.
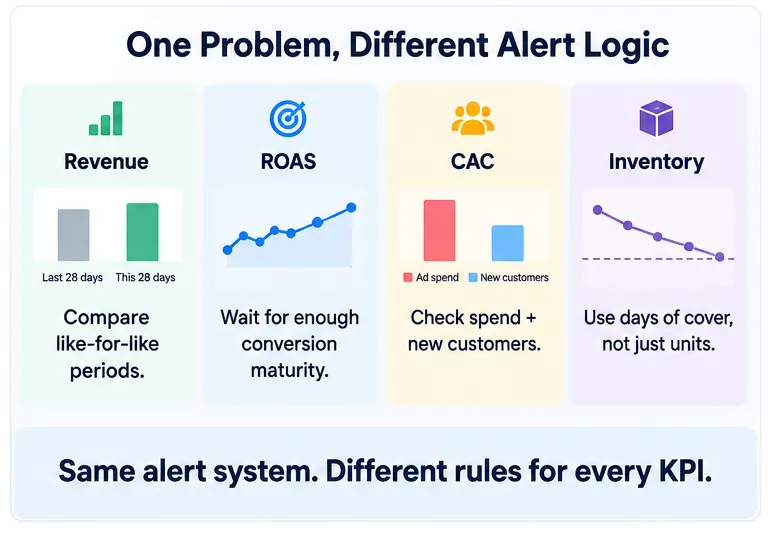
Revenue may need to be compared with similar weekdays and hours.
Conversion might require separate baselines for mobile and desktop.
CAC may be better compared with a rolling average or profitability target.
Inventory risk depends more on sales velocity and replenishment time than yesterday’s inventory level.
Google Analytics uses historical time-series data in its anomaly detection to estimate expected behaviour and flag observations that fall outside an expected range. Google Analytics anomaly detection documentation
The lesson is simple:
Do not compare against the easiest baseline. Compare against the most relevant one.
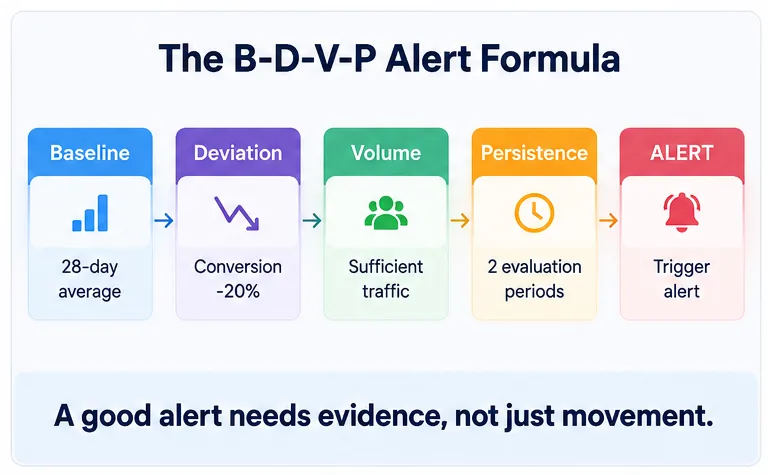
The B-D-V-P Framework for Setting Smarter KPI Alert Thresholds
A practical alert can be designed using four elements.
B: Baseline
What does normal performance look like?
D: Deviation
How far must the KPI move before the change matters?
V: Volume
Is there enough traffic, spend, orders or conversions to trust the signal?
P: Persistence
How long must the condition continue before the alert fires?
Put together:
Baseline + Deviation + Volume + Persistence
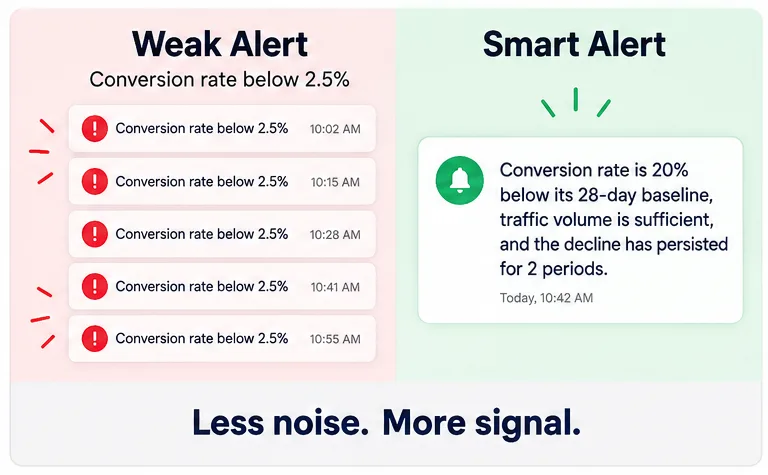
Compare these two rules.
- Weak alert: Conversion rate below 2.5%.
- Stronger alert: Overall conversion rate is 20% below its 28-day comparable baseline after sufficient traffic volume and has remained below the expected range for two evaluation periods.
The second alert understands both magnitude and evidence.
It also prevents a common mistake: assuming a large percentage change must be important.
A 50% conversion decline after 20 sessions could be noise.
A 15% decline after 20,000 sessions may deserve immediate attention.
Static vs Percentage vs Dynamic KPI Thresholds: Which One Should You Use?
Different KPIs need different types of thresholds.
|
Threshold Type
|
Example
|
Best Used For
|
|
Static
|
CAC above $50
|
Hard business limits
|
|
Percentage
|
Revenue down 15%
|
Relative performance changes
|
|
Dynamic
|
Revenue outside expected range
|
Seasonal or volatile metrics
|
|
Multi-condition
|
ROAS down + minimum spend reached
|
Noisy performance metrics
|
Static thresholds
Static thresholds use a fixed limit.
Examples:
These work well when you genuinely have a hard business boundary.
Percentage thresholds
These compare current performance against a baseline.
For example:
Alert when conversion falls more than 20% versus its 28-day comparable average.
This works well for revenue, conversion, orders and AOV.
Dynamic thresholds
Dynamic thresholds adapt to historical behaviour.
Microsoft Azure Monitor’s dynamic thresholds learn historical patterns, including hourly, daily and weekly behaviour, and can require several violations before raising an alert. This helps reduce noise from temporary spikes.
For ecommerce, this matters because Monday morning should not automatically be treated like Saturday evening.
The strongest monitoring setup often uses a combination of all three.
Practical KPI Alert Threshold Examples for Ecommerce Teams
There is no universal threshold every store should copy.
Order volume, margins, traffic, seasonality and average order value all affect how sensitive an alert should be.
Use these as starting points to test, not industry benchmarks.
|
KPI
|
Example Starting Rule
|
|
Revenue
|
10 to 15% below comparable baseline for 2 periods
|
|
Conversion Rate
|
15 to 20% below baseline after minimum traffic
|
|
CAC
|
15 to 20% above baseline after sufficient spend and customer volume
|
|
ROAS
|
15 to 20% below baseline after adequate conversion maturity
|
|
AOV
|
10 to 15% below rolling baseline
|
|
Refund Rate
|
Meaningfully above normal range after minimum orders
|
|
Inventory
|
Days of cover below replenishment lead time
|
The real question is not:
“What percentage should we use?”
It is:
“At what point would this change alter a real business decision?”
How to Set Revenue Alert Thresholds Using Comparable Performance Periods
Revenue is usually the first metric founders want monitored.
It is also easy to configure badly.
Suppose your store typically generates:
$3,000 between 8 AM and 10 AM
but:
$14,000 between 6 PM and 8 PM
A generic “revenue below $5,000” alert becomes meaningless.
A stronger rule could say:
Revenue is 17% below the average for the same weekday and time window over the previous four weeks, and the decline has persisted for two evaluation periods.
Now add context:
Sessions are stable, but conversion is down 19%.
The first statement detects the issue.
The second begins to explain it.
That is where AI ecommerce analytics can complement monitoring. The threshold tells you something has changed. Analysis helps identify what may be driving it.
Catch the change before it becomes expensive
How to Set ROAS Alert Thresholds Without Reacting Too Early
ROAS alerts need patience because attribution is not always immediate.
Imagine your dashboard shows:
Morning:
- Spend: $700
- Revenue: $350
- ROAS: 0.5x
The alert fires.
By noon:
- Spend: $1,900
- Revenue: $5,700
- ROAS: 3.0x
There may never have been a genuine performance problem.
Google Ads explains that conversion lag can temporarily make CPA appear higher and ROAS lower because some conversions have not yet been reported.
A better ROAS alert combines:
Minimum spend + Minimum conversions + Evaluation window + Deviation threshold
The correct evaluation window depends on how quickly your customers usually convert.
Once a meaningful alert fires, use a structured investigation such as the 12-point ROAS optimisation checklist rather than immediately reducing spend.
How to Set CAC Alert Thresholds Using Both Ad and Store Performance
Suppose CAC rises from $40 to $49.
That is a 22.5% increase.
The problem could be:
- CPM increased
- CTR declined
- CPC increased
- Store conversion weakened
- Spend grew faster than new customers
- Campaign mix changed
- A high-converting promotion ended
A weak notification says:
CAC above $45.
A stronger one says:
CAC is 22% above its four-week baseline. Spend increased 11%, while new-customer orders fell 9%.
Now the team has somewhere to begin.
When media costs rise but conversion remains healthy, acquisition deserves investigation.
When traffic costs remain stable but store conversion falls, changing campaigns may not solve the problem.
CAC should also be viewed alongside customer value and payback. The relationship between CAC, LTV and D2C profitability provides more commercial context than CAC alone.
Why Conversion Rate Alerts Need a Minimum Traffic Threshold
Conversion rate becomes unreliable when the denominator is small.
A store receiving 40 sessions can fall from 5% conversion to 2.5% because of just one fewer purchase.
The same percentage decline across 10,000 sessions is far more significant.
Instead of:
Conversion below 2%.
Use something closer to:
Mobile conversion is 18% below its 28-day baseline after at least 1,500 sessions and has remained weak for two evaluation periods.
Once triggered, investigate the funnel:
Landing Page → Product Page → Add to Cart → Checkout → Purchase
Understanding your normal ecommerce conversion rate provides a better reference than blindly applying a generic benchmark.
How to Set Inventory Alerts Using Sales Velocity and Days of Cover
Inventory alerts should monitor risk, not just units.
Consider two SKUs.
Product A: 10 units remaining, sells 1 per week.
Product B: 10 units remaining, sells 20 per day.
A “stock below 10” alert treats them as equally urgent.
They clearly are not.
A better measure is:
Available Inventory ÷ Average Daily Sales = Estimated Days of Cover
Shopify’s inventory reports include measures such as average units sold per day and estimated days of inventory remaining, which can support this type of monitoring. Shopify inventory reporting documentation
A more actionable alert could say:
High-revenue SKU has fewer than seven days of stock cover, replenishment requires ten days, and sales velocity is rising.
Now operations have time to replenish, reduce promotion or redirect demand.
The wider commercial impact is covered in our guide to stockouts and overstock in ecommerce.
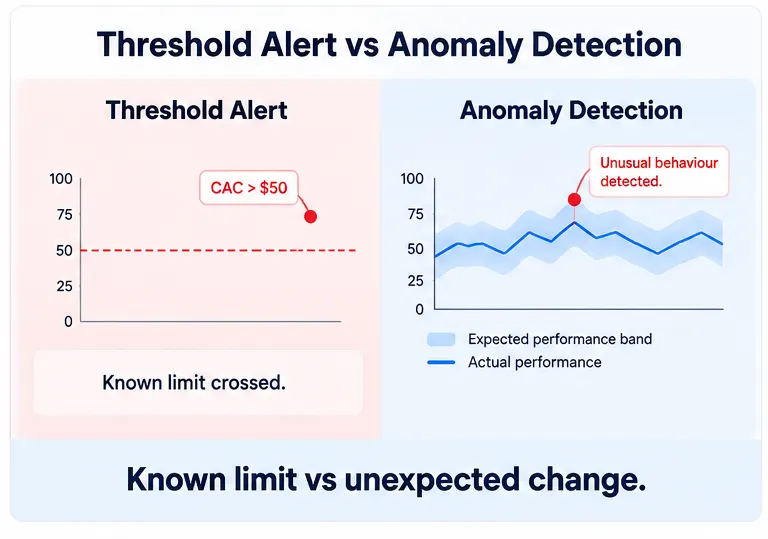
KPI Threshold Alerts vs Anomaly Detection: What Is the Difference?
These approaches solve related but different problems.
|
Threshold Alerts
|
Anomaly Detection
|
|
Follow a predefined rule
|
Learn expected behaviour
|
|
Example: CAC above $50
|
CAC unusually high for this period
|
|
Protect known limits
|
Surface unexpected changes
|
|
Easy to explain
|
Better for changing patterns
|
|
Requires a defined boundary
|
Can identify issues you did not explicitly predict
|
A threshold asks:
“Did this KPI cross the limit we care about?”
Anomaly detection asks:
“Is this behaviour unusual compared with what normally happens?”
Google Analytics reflects this distinction through custom insights based on user-defined conditions and automated insights that surface unusual changes or emerging trends. Google Analytics Insights documentation
For ecommerce teams, combining both is usually stronger.
Hard thresholds protect known limits. Anomaly detection catches unexpected behaviour.
When a KPI Change Should Not Trigger an Automated Alert
Not every negative movement deserves an interruption.
Keep an alert quiet when:
- Sample size is too small
- The movement matches normal seasonality
- Advertising conversions are still arriving
- A planned campaign explains the change
- The deviation lasted only one short interval
- Nobody can act on the notification
- The KPI is useful for reporting but not immediate action
A useful test is:
“If this alert arrives at 3 PM today, will somebody do something differently?”
If the answer is no, the metric probably belongs in a report rather than an alert.
How Poor KPI Alert Configuration Creates Alert Fatigue
Alert fatigue usually begins with poor rules, not too many channels.
Three controls help.
Persistence
Require multiple violations before triggering.
Severity
|
Severity
|
Example
|
Delivery
|
|
Critical
|
Checkout failure, major revenue collapse
|
Immediate WhatsApp/Slack
|
|
High
|
Significant conversion or ROAS decline
|
Slack + owner
|
|
Medium
|
CAC drifting above target
|
Scheduled digest
|
|
Low
|
Emerging non-urgent trend
|
Dashboard/report
|
Ownership
Each important alert needs someone responsible for investigating it.
Revenue might belong to growth.
CAC to performance marketing.
Conversion to ecommerce or CRO.
Inventory to operations.
Refund spikes to CX or fulfillment.
A technically perfect alert without ownership still fails.
How KPI Monitoring Can Evolve Into Ecommerce Decision Intelligence
Thresholds solve the detection problem.
They do not automatically solve diagnosis.
A mature workflow looks like:
Detect → Contextualise → Investigate → Prioritise → Act
This is where Netification and iSight play different roles within NetSights.
Netification can surface performance updates and KPI threshold breaches through WhatsApp, Slack or email. Its product page currently describes both daily reports and real-time KPI alerts delivered through those channels.
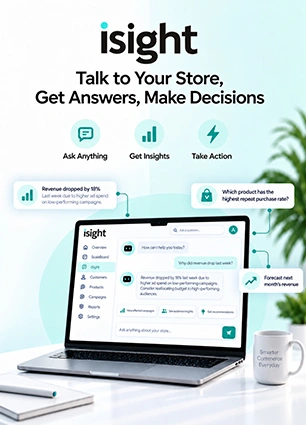
iSight can then help teams investigate the wider performance signals behind the change.
The aim is not more notifications.
It is a shorter distance between problem and decision.
Stop checking dashboards for problems. Let meaningful changes come to you
A Simple KPI Alert Setup Ecommerce Teams Can Start With
Do not begin with 50 alerts.
Start with metrics where delayed action can directly cost money:
Revenue, Conversion Rate, CAC, ROAS and Inventory Risk
Then apply seven steps:
- Choose the most relevant baseline.
- Define the deviation that would alter a decision.
- Add minimum traffic, spend or order volume.
- Require persistence where short-term noise is common.
- Assign an owner.
- Route the alert based on urgency.
- Review false alarms and missed events regularly.
Thresholds are not “set and forget.”
As traffic, spend, product mix and seasonality change, normal behaviour changes too.
Your alert rules should evolve with the business.
Conclusion: Catch KPI Problems Before They Become Expensive
Effective KPI monitoring is not about watching every number every minute.
It is about recognising meaningful changes early enough to respond.
The strongest KPI alert thresholds combine:
Baseline + Deviation + Volume + Persistence + Ownership
That combination helps separate ordinary fluctuation from genuine business risk.
Instead of repeatedly asking:
“Is something wrong?”
your team can spend more time asking:
“Why did this happen, how much does it matter, and what should we do next?”
That is the shift from passive reporting towards ecommerce decision intelligence.
With NetSights, Netification can surface important changes while iSight helps teams investigate what may be driving them.
Catch the problem while it is still a signal, not after it becomes a cost.
Ready to automate your ecommerce monitoring?
FAQs