
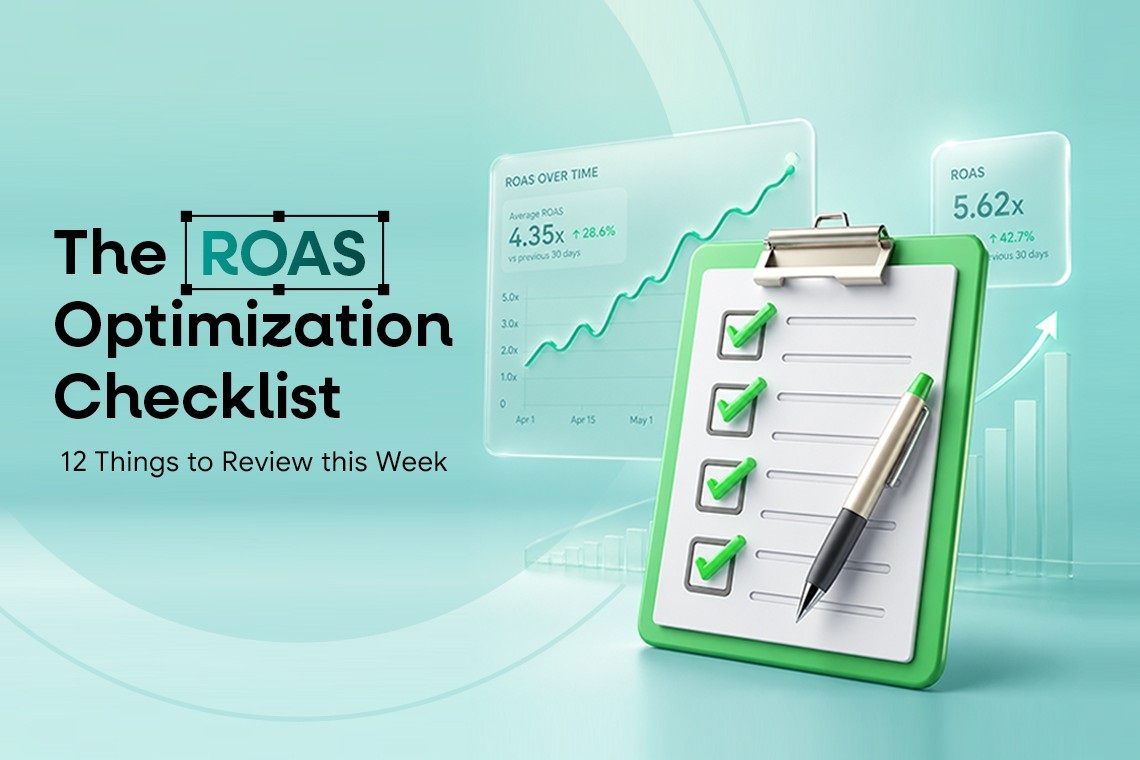
ROAS is usually one of the first numbers an eCommerce team checks when paid ads start behaving differently.
If ROAS is going up, everyone feels confident. If it drops, the questions start immediately. Is the ad creative getting old? Is the campaign reaching the wrong audience? Is the landing page not converting? Is the offer too weak? Are we selling products with poor margins? Or is the ad platform showing one version of performance while Shopify, inventory, and finance data are showing another?
That is why ROAS optimization is not just about changing ad budgets.
It is a full performance review. ROAS, or return on ad spend, tells you how much revenue your ads generated compared to what you spent. But it does not always tell you whether that revenue is healthy, profitable, or scalable.
A campaign can show good ROAS and still create weak profit. Another campaign can show average ROAS but bring better customers, stronger margins, and higher repeat purchases over time.
So the real goal is not to chase the highest ROAS number inside an ad platform. The goal is to understand whether your ad spend is helping the business grow in the right way.
This checklist will help you review the areas that usually affect ROAS, including campaign structure, creative fatigue, product feed quality, landing page CRO, attribution, product margins, inventory, offers, customer quality, and reporting clarity.
ROAS is calculated using a simple formula:
ROAS = Revenue from ads ÷ Ad spend
If you spend ₹50,000 on ads and generate ₹2,00,000 in revenue, your ROAS is 4x. That means every ₹1 spent on ads generated ₹4 in revenue.
That sounds useful, and it is. But it becomes risky when teams treat ROAS as the only success metric.
ROAS shows revenue efficiency. It does not show what happened after the order came in. It does not include product cost, discounts, returns, payment fees, shipping, packaging, fulfilment, or customer support costs.
This is where many brands make the wrong call. They scale the campaign with the best platform ROAS, only to realise later that the product margin was weak, repeat purchases were low, or the customers were not valuable enough.
WARC’s ROI Benchmarks Report also highlights this difference. Its analysis of successful campaigns found a median revenue ROI of 4.33:1, while the median profit ROI was lower at 2.5:1. That gap is a good reminder that revenue return and profit return are not the same thing.
For a deeper view of this difference, you can also read Netsights.ai’s guide on profitable revenue vs ROAS.
Daily checks are helpful when something urgent happens. But weekly reviews are where you start seeing patterns.
One bad day does not always mean your ads are failing. It could be seasonality, tracking delay, auction pressure, a budget change, or a temporary drop in conversions. But if ROAS keeps falling across the week, your team needs a proper review process.
A weekly ROAS optimization checklist helps you slow down and ask better questions. Instead of only asking, “Which campaign dropped?”, you start asking:
What changed in spend? Did the audience expand? Is the creative still working? Are product pages converting? Are we promoting the right products? Are margins strong enough? Are we getting good customers or just cheap first orders?
This matters because many teams lose efficiency without realising it. Nielsen’s ROI research highlights what it calls the “50-50-50 Gap,” where 50% of media plans are underinvested by a median of 50%, and ROI can improve by 50% with the ideal budget. You can read the summary through Nielsen’s media ROI research release.
For founders who want a wider weekly review rhythm, this Netsights.ai guide on weekly eCommerce metrics for founders can help connect ROAS with CAC, revenue, customer behaviour, and profitability.
Review the paid media signals that need attention before your budget gets wasted
ROAS tells you how much revenue came from your ad spend.
POAS, or Profit on Ad Spend, tells you how much profit came from your ad spend.
That difference matters a lot.
A campaign with 5x ROAS may look excellent at first glance. But if it sells low-margin products, depends on heavy discounts, or has a high return rate, the actual profit may be much lower than expected.
On the other hand, a campaign with 3x ROAS may be healthier if it sells products with stronger margins and brings customers who buy again.
This is why ROAS optimization should not happen in isolation. It should be reviewed with POAS, contribution margin, blended ROAS, MER, CAC, average order value, repeat purchase rate, and revenue per customer.
A mature paid media team does not only ask, “What is our ROAS?”
It also asks, “Is this ROAS creating profitable revenue?”
Many marketers search for a Facebook ads ROAS benchmark or a Google Ads return on ad spend benchmark because they want a quick answer.
The problem is that ROAS benchmarks are not universal.
A good ROAS depends on your product category, average order value, gross margin, contribution margin, funnel stage, offer, repeat purchase rate, attribution window, and customer quality.
A skincare brand with strong repeat purchases may work with a different ROAS target than a fashion brand with seasonal buying behaviour. A premium product with strong margins can sometimes afford a lower ROAS than a low-margin product that depends on high order volume.
So instead of copying someone else’s benchmark, build your own.
Look at ROAS by channel, campaign type, product category, funnel stage, margin profile, and customer segment. That will give your team a much more useful benchmark than a generic industry number.
ROAS optimization should also not mean cutting every activity that does not convert immediately. Nielsen has written about the link between brand metrics and sales, showing why short-term efficiency and long-term demand should be balanced carefully. You can refer to Nielsen’s research on marketing effectiveness and data-driven decisions.
Build ROAS benchmarks around your products, margins, and customer quality, not generic industry numbers
Start by finding where the drop is actually happening.
If ROAS dropped only in Meta Ads but Google Ads stayed stable, the issue may be creative fatigue, audience saturation, campaign structure, or attribution inside one platform.
If Google Ads declined but Meta stayed steady, you may need to review search terms, product feed quality, Shopping campaigns, Performance Max performance, or bidding strategy.
The bigger concern is when platform ROAS, blended ROAS, and total store revenue all weaken together. That usually means the problem is wider than one campaign. It could be conversion rate, stock availability, discount fatigue, website performance, lower demand, or offer-market fit.
Do not make decisions from one dashboard alone. Compare platform ROAS with Shopify revenue, blended ROAS, MER, product performance, and customer quality before changing budgets.
ROAS can drop when a campaign is scaled too quickly.
That does not always mean the campaign has stopped working. Sometimes, the campaign is simply moving beyond the audience that was easiest to convert.
For example, when a campaign is spending ₹10,000 per day, it may be reaching people who already have strong buying intent. But when the budget is increased to ₹50,000 per day, the platform has to find more people to show the ads to. That often means reaching broader, colder, or less purchase-ready audiences.
Naturally, this can bring down short-term ROAS.
So before reducing the budget immediately, look at what changed around the campaign. Did the spend increase sharply? Did the audience size expand? Did frequency, CPM, CTR, conversion volume, or customer quality shift?
Instead of only asking, “Why did ROAS drop?”, ask, “Did the campaign become inefficient, or did we push it beyond the audience that was already converting well?”
This is where ad spend efficiency needs a wider view. If the budget increased but product margins, landing page performance, and customer quality did not support that growth, the ROAS drop may not be just a campaign issue. It may be a sign that the business was not fully ready to scale that spend.
Creative fatigue is one of the most common reasons ROAS starts falling.
You may notice this when frequency rises, CTR drops, CPM increases, or cost per purchase slowly becomes more expensive. The campaign is still spending, but the creative is no longer creating the same level of attention.
This is common when the same ad has been running for too long, especially in retargeting campaigns or smaller audience pools.
Creative quality is not just a design issue. It can directly affect profit. Kantar and WARC’s article on how creative quality drives profit shares evidence that the most creative and effective ads generate more than four times as much profit.
Kantar’s creative effectiveness analysis also shows that creative quality contributes to nearly 50% of media impact.
That means creative review should be part of your weekly ROAS optimization process, not something you do only when performance has already dropped badly.
Review the hook, format, offer, product angle, testimonial, visual style, and landing page match. If the same message has been running for too long, test new variations.
For a stronger testing process, use this A/B testing framework for ROAS in eCommerce to structure your creative, landing page, and offer experiments.
Catch creative fatigue before your best ads quietly stop performing
Google Ads return on ad spend can fall when campaigns start spending on weak search terms or poor product data.
In Search campaigns, the keyword may look relevant, but the actual search terms may tell a different story. You may be paying for broad, low-intent, or research-heavy queries that are unlikely to convert.
In Shopping campaigns and Performance Max, product feed quality becomes very important. Weak product titles, missing attributes, unclear descriptions, poor categorisation, and low-quality images can all reduce performance.
Product-level margin also matters. A campaign may push products that convert easily, but those products may not always be the most profitable.
So when you review Google Ads, do not stop at campaign ROAS. Look at search terms, product feed health, conversion value tracking, product margins, and whether the promoted SKUs are worth scaling.
Ad platforms show performance through their own reporting and attribution systems.
Shopify shows total store revenue. Finance shows profit later. Inventory tools show stock movement. Retention platforms show repeat orders. If these views are not connected, your team can easily make decisions from an incomplete picture.
A campaign may show strong platform ROAS while blended ROAS stays flat. This can happen when paid channels claim credit for conversions that may have happened anyway, or when ad spend is not actually increasing total store revenue enough.
That is why blended ROAS works as a reality check.
It helps you understand whether paid media is moving the business forward, or only looking good inside one reporting platform.
Review platform ROAS with blended ROAS, MER, CAC, total revenue, product performance, and customer quality.
Paid traffic can only perform if the landing page converts.
A campaign may bring the right audience, but if the product page is slow, unclear, or difficult to use, ROAS will suffer. In many cases, the ad is not the only problem. The post-click experience is.
Baymard Institute’s cart abandonment research puts the average cart abandonment rate at 70.22%, based on 50 studies. That shows how much buying intent can disappear after users have already moved close to purchase.
Baymard’s checkout UX research also suggests that the average large-scale eCommerce site can improve conversion rate by around 35% through better checkout design.
This means some low ROAS problems are not really ad problems. They are product pages, checkout, or UX problems.
Review product images, product benefits, price clarity, reviews, trust signals, return policy, delivery information, mobile layout, checkout flow, and page speed.
If people click the ad but struggle to complete the order, ROAS will fall even when the campaign is bringing relevant traffic.
Find whether your ROAS problem is coming from ads, landing pages, or checkout friction
A strong offer can improve conversion. But an offer that depends too much on discounts can quietly damage profit.
Discount-led campaigns often increase orders. But they can also reduce contribution margin. So even if ROAS looks better, the profit per order may be weaker.
This is where many teams get misled. More revenue does not always mean better business performance.
A better offer does not always mean a bigger discount. It can be a smarter bundle, clearer value framing, a free shipping threshold, a limited-time bonus, better product education, or a stronger reason to buy now.
When you review ROAS, check whether the offer is genuinely improving demand or simply training customers to wait for discounts.
ROAS optimization should improve conversion and protect profitability.
Product-level performance can completely change how you read ROAS.
Some products convert easily but have weak margins. Others may convert at a lower rate but create more profit. If your campaigns keep scaling low-margin products, your ROAS may look acceptable while actual profit stays weak.
For example, a product with 6x ROAS but poor contribution margin may be less valuable than a product with 3.5x ROAS and stronger margins.
This is why ROAS should be reviewed with product cost, fulfilment cost, discounting, return rate, stock status, and repeat purchase potential.
ROAS tells you revenue efficiency. POAS and contribution margin help you understand whether the campaign is actually creating profitable growth.
Attribution can change the way ROAS looks.
If tracking is broken, duplicated, delayed, or incomplete, ROAS reporting becomes unreliable. If attribution settings change, the same campaigns may suddenly look better or worse even when customer behaviour has not changed much.
Tracking issues can also create false confidence. A campaign may look strong because conversions are duplicated. Another may look weak because important purchase events are not being passed correctly.
Review UTMs, purchase events, duplicate conversions, conversion windows, Shopify revenue matching, Meta Pixel, Google Ads tags, GA4 events, and whether different platforms are reporting the same order differently.
The goal is not to make every platform show the exact same number. That rarely happens. The goal is to understand why the numbers differ and which view should guide your budget decisions.
ROAS can fall when ads send traffic to products that are out of stock, low in stock, or missing key variants.
This happens more often than teams realise because paid media and inventory are usually reviewed separately.
The marketing team may continue spending on a product because campaign performance looks strong. At the same time, the operations team may already know that stock is running low.
Once the product becomes unavailable, traffic starts leaking. Customers may leave the page, buy a lower-value alternative, or abandon the store completely.
A weekly ROAS review should include inventory visibility. If a product is low in stock, shift budget, promote alternatives, or update the landing page before wasted spend increases.
A high first-order ROAS does not always mean the campaign is bringing strong customers.
Some campaigns attract buyers who purchase once and never return. Others may bring customers who repeat, refer, subscribe, or buy higher-margin products later.
That is why customer quality matters.
McKinsey’s personalization research shows that 71% of consumers expect personalised interactions, and 76% get frustrated when they do not receive them.
For eCommerce brands, paid traffic performance does not end at the first order. The post-click and post-purchase experience can affect repeat revenue, customer lifetime value, and long-term ROAS.
Review ROAS with repeat purchase rate, revenue per customer, customer lifetime value, and LTV:CAC ratio.
A campaign with lower first-order ROAS may still be better if it brings customers who return. A campaign with strong short-term ROAS may be weaker if those customers never buy again.
Most ROAS problems do not come from one place.
A drop may come from creative fatigue, weaker traffic, landing page friction, product margin, attribution changes, checkout issues, stockouts, discount dependency, or poor repeat purchase behaviour.
The hard part is that these signals usually live in different tools.
Ad platforms show campaign performance. Shopify shows orders and revenue. Inventory tools show stock. Retention platforms show repeat purchase activity. Finance shows margin later.
When everything is scattered, ROAS optimization becomes slow and reactive.
This is where eCommerce decision intelligence becomes useful. It connects marketing, store, product, customer, and revenue data so teams can identify the real cause faster.
McKinsey’s customer analytics research also supports this direction. It found that intensive users of customer analytics were 23 times more likely to outperform competitors in new-customer acquisition, 9 times more likely to outperform in customer loyalty, and almost 19 times more likely to achieve above-average profitability.
You can also read this guide on the difference between dashboards and a scaleboard to understand why decision-ready analytics is more useful than simply adding more charts.
Connect your ads, store, products, and revenue data to understand what is really affecting ROAS
Netsights.ai is built for eCommerce teams that need more than separate dashboards.
A ROAS review usually starts with one simple question: why did performance change?
But answering that question often takes time because the answer is not sitting in one place. You may need to check ad performance, Shopify revenue, product margins, customer behaviour, inventory movement, and profitability together.
That is the gap Netsights.ai helps close.
A better ROAS review usually has four stages: detect, diagnose, prioritise, and act.
First, the team needs to detect the change. ROAS may drop, CAC may rise, revenue may shift, or a product may start moving unusually fast. Netification supports this stage by helping teams receive alerts when important KPIs change.
Next, the team needs to diagnose the cause. Is the issue coming from ads, Shopify conversion, inventory, product margin, or customer behaviour? iSight helps teams view store performance, Shopify analytics, product performance, customer behaviour, campaign impact, and revenue trends in one place.
Then comes prioritisation. Not every ROAS drop deserves the same response. A small dip on a low-spend campaign is different from a sharp decline on a high-spend campaign promoting a hero product. Connected analytics helps teams decide what needs action first.
Finally, the team needs to ask better questions and move faster. Netty helps teams explore questions such as, “Why did ROAS drop this week?”, “Which product is hurting return on ad spend?”, “Is blended ROAS moving with platform ROAS?”, or “Which campaign should we review first?”
The value of the Netsights.ai ecosystem is not only that it shows data. It helps teams move from scattered reporting to a clearer decision workflow.
Stop switching between dashboards. Find what needs action in your ROAS review faster
If your team is struggling to connect ROAS, CAC, product performance, revenue quality, inventory, and customer behaviour, the issue may not be your ads alone.
It may be your analytics workflow.
When every team works from a different dashboard, paid media decisions become slower and less confident. The media buyer sees platform ROAS. The founder sees Shopify revenue. The operator sees inventory. The finance team sees margin. But nobody sees the full picture at the same time.
If that sounds familiar, you can contact the Netsights team to discuss how connected eCommerce analytics can support your reporting and growth workflow.
Not sure what is hurting ROAS? Review your analytics setup with the Netsights.ai team
ROAS optimization is not guesswork.
It is not only about increasing budgets, pausing campaigns, or refreshing creatives. A proper ROAS review looks at the full system behind paid media performance: campaign structure, creative fatigue, search terms, product feed quality, landing page CRO, offer strength, attribution, product margins, stock availability, customer quality, and repeat purchase behaviour.
The brands that improve ROAS consistently are usually not the ones staring at one dashboard harder. They are the ones connecting the right signals and acting on them with more clarity.
Return on ad spend is connected to profit, product performance, customer acquisition, inventory, retention, and revenue quality. When these signals are reviewed together, the team can make better decisions.
If your team wants to stop guessing why ROAS changed, start your free trial and explore how Netsights.ai helps eCommerce teams find the signals that need action.
Stop guessing why ROAS changed. Start finding the signals that need action
A: ROAS optimization is the process of improving the revenue generated from ad spend. It includes reviewing campaigns, creatives, landing pages, offers, attribution, margins, and customer quality.
A: You can improve ROAS by improving targeting, refreshing creatives, optimising landing pages, reducing wasted spend, improving product feed quality, and focusing budget on higher-margin products.
A: Low ROAS can be caused by creative fatigue, weak targeting, poor landing page conversion, high discounts, low product margins, tracking issues, attribution changes, stockouts, or poor customer quality.
A: There is no universal Facebook ads ROAS benchmark. It depends on your category, margins, AOV, offer, attribution window, customer quality, and repeat purchase behaviour.
A: Return on ad spend is calculated by dividing revenue from ads by ad spend. It shows how much revenue is generated for every unit spent on advertising.
A: ROAS measures revenue from ad spend. POAS measures profit from ad spend, which makes it more useful when margins, discounts, returns, and fulfilment costs matter.
A: Blended ROAS helps brands understand total paid media impact across the whole store. It can reveal whether platform-reported ROAS is actually improving overall revenue efficiency.
A: Netsights.ai helps teams connect ads, store, product, customer, inventory, and revenue data. This makes it easier to find what is affecting ROAS and take faster action.
We write about growth, retention, and the numbers that actually predict what happens next for D2C brands. Have a topic you'd like us to cover? Get in touch .
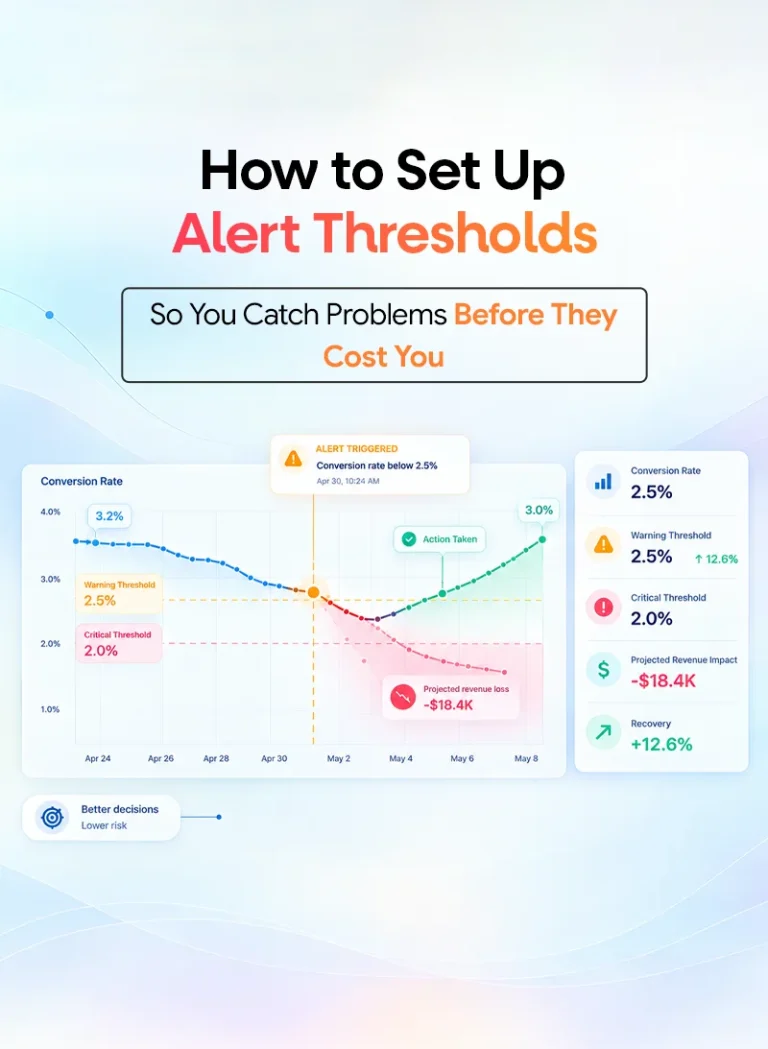
Your ecommerce store already contains the answers. Learn how AI ecommerce analytics helps founders ask business questions, understand what changed and why, and move from scattered data to clearer decisions.
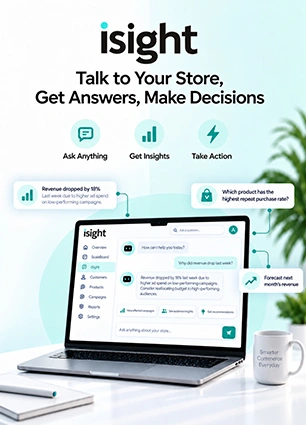
Your ecommerce store already contains the answers. Learn how AI ecommerce analytics helps founders ask business questions, understand what changed and why, and move from scattered data to clearer decisions.
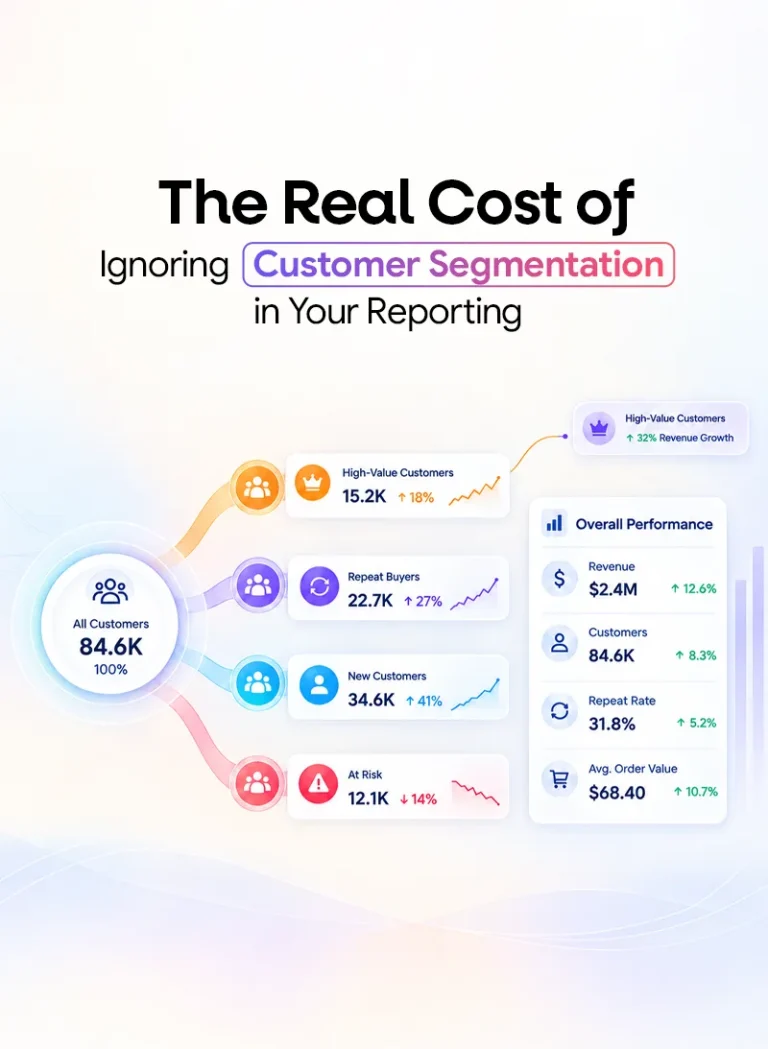
Compare Shopify conversion rate benchmarks by industry, device, traffic source, and customer type. See what a good conversion rate looks like in 2026 and learn how to benchmark your store more accurately.