
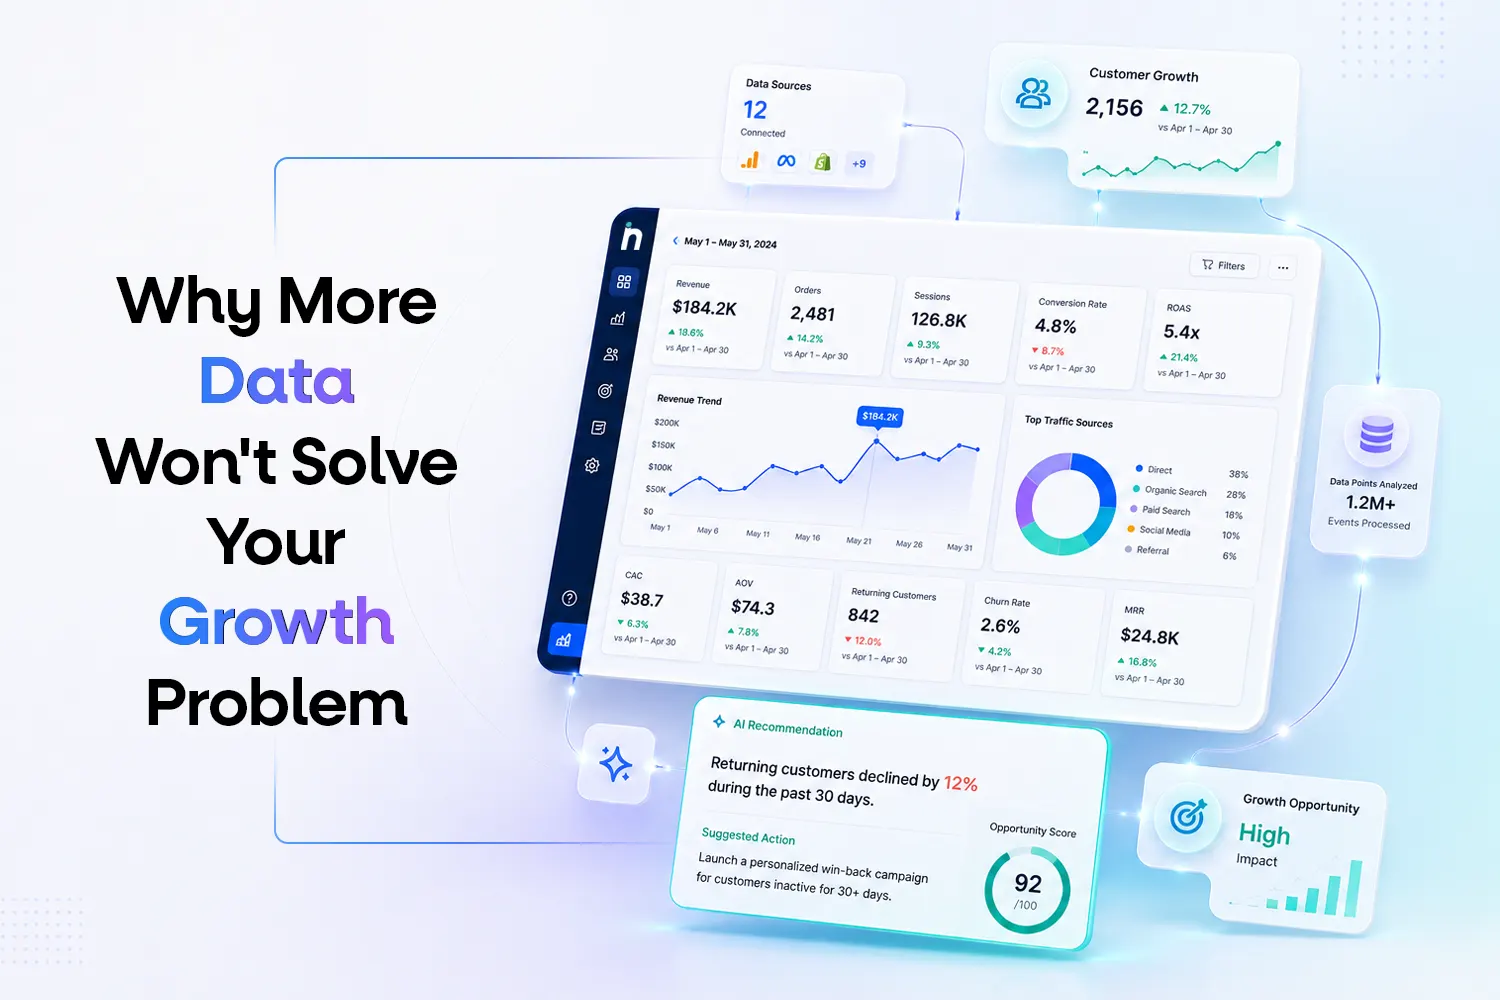
Most ecommerce businesses do not have a data shortage. They have a decision shortage.
A growing D2C brand already has access to Shopify revenue reports, GA4 behaviour data, Meta Ads performance, Google Ads attribution, CRM activity, product-level sales, inventory movement and customer retention metrics. Each platform produces more reports, charts and metrics than most leadership teams can realistically review.
Yet founders still struggle to answer basic growth questions with confidence.
Why did revenue decline even though website traffic increased? Why did customer acquisition cost rise when platform-reported ROAS remained stable? Is the business acquiring valuable customers or merely generating discounted first-time orders? Which performance issue deserves immediate attention, and which one is normal variation?
These are not data-collection questions. They are decision questions.
A successful data-driven growth strategy does not depend on collecting every possible data point. It depends on connecting the right information, establishing context, identifying the likely cause of a performance change and deciding what the business should do next.
More data is only valuable when it improves the quality or speed of a decision. Without that connection, it simply creates more reporting work.
See what changed. Understand why. Know what to do next.
Modern ecommerce platforms are highly effective at recording what happens across the customer journey.
Shopify captures revenue, orders, products, discounts, refunds and customer transactions. GA4 records website events, traffic sources and ecommerce behaviour. Meta Ads and Google Ads report spend, clicks, conversions and attributed revenue. CRM and retention platforms track engagement, repeat purchases and customer segments. Inventory and fulfilment systems add operational data around availability, shipping and returns.
The result is a business environment with extensive visibility but limited clarity.
Google’s official ecommerce measurement documentation demonstrates how detailed online behaviour can be tracked through events such as product views, additions to cart, checkout activity, purchases and refunds. However, collecting those events does not by itself explain why overall performance changed or which business action should follow.
A dashboard may show that checkout completion declined. It may not tell the business whether the decline was caused by a mobile usability problem, a payment-gateway failure, lower-quality traffic, an unavailable product or a change in the offer.
This distinction is critical. Data can reveal the symptom without identifying the underlying commercial problem.
Suppose a founder reviews the following information on Monday morning:
Revenue is down by 9%. Website traffic is up by 14%. Meta Ads ROAS is stable. Average Order Value has declined. Repeat-customer revenue is weaker, and one of the highest-selling products is out of stock.
Every number may be accurate. However, the business still needs to determine what caused the revenue decline and where to act first.
Reducing advertising spend may be the wrong response if the actual problem is checkout performance. Increasing traffic may make the situation worse if the highest-demand product is unavailable. Launching another discount may improve conversion while further weakening Average Order Value and contribution margin.
The business has information, but it does not yet have a decision.
This is why ecommerce decision intelligence is becoming more relevant for growth teams. It connects isolated performance signals and converts them into a more complete understanding of what changed, why it may have changed and what should be investigated next.
The assumption that more information always creates better decisions sounds reasonable, but it ignores the practical limits of human attention and organisational capacity.
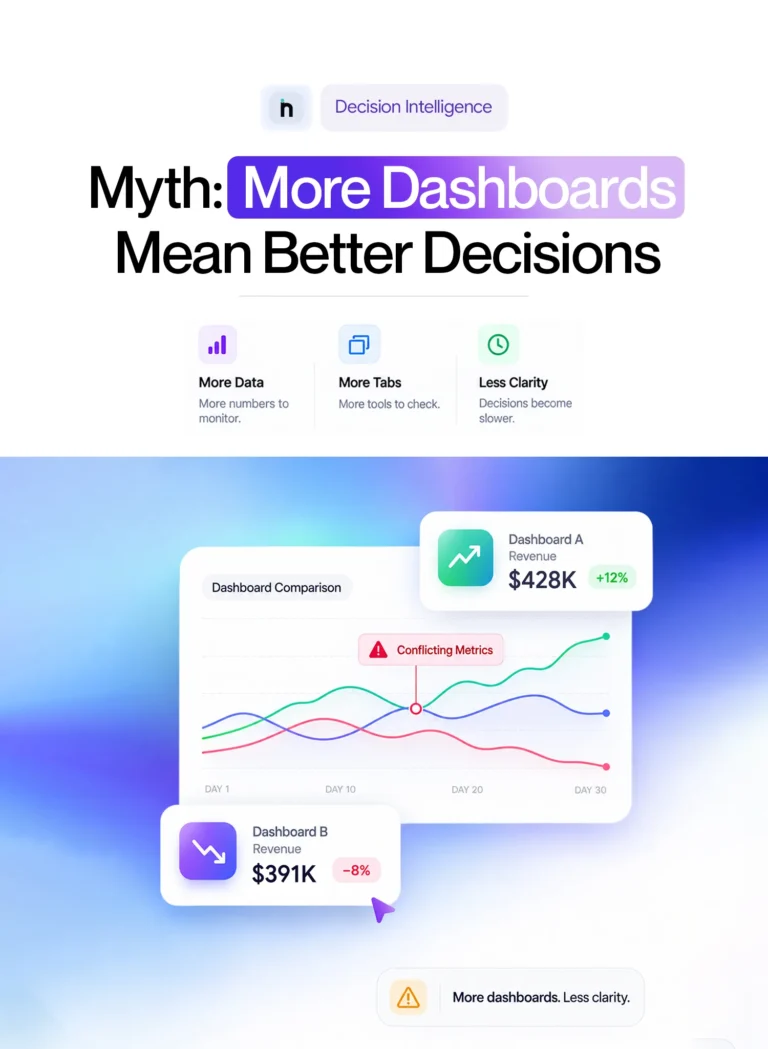
Every additional dashboard requires someone to review it, interpret it and reconcile it with other sources. As reporting systems expand, teams often spend more time preparing explanations and less time acting on them.
The problem is not that data is inherently harmful. The problem is that the volume and complexity of the available information can become greater than the team’s ability to process it meaningfully.
Dashboard fatigue develops when teams continuously review charts, alerts and KPI reports without gaining a clear understanding of what deserves action.
A founder may receive a Shopify summary, a GA4 report, two advertising-platform updates, a retention dashboard and a manually prepared spreadsheet. The same revenue movement may be represented differently in each report because the platforms use different attribution windows, conversion definitions, refresh cycles and revenue calculations.
The team then spends its review meeting debating which number is correct.
That is not data-driven decision-making. It is data reconciliation.
The problem becomes more severe when every metric is given equal importance. A minor change in email open rate may receive the same visual emphasis as a major decline in checkout conversion. A platform-level increase in ROAS may distract from falling contribution margin. An increase in traffic may appear positive even when the additional visitors are not converting.
The business becomes busy discussing performance but remains unclear about its priorities.
Metrics are useful only when they represent an underlying business objective. Once the metric becomes the objective, teams can optimise the number while weakening the business.
Harvard Business Review has examined how performance metrics can begin to displace the strategy they were originally intended to support. When teams focus on improving a visible KPI without examining the underlying commercial outcome, measurement can produce the wrong behaviour.
An ecommerce team, for example, may optimize conversion rate through aggressive discounting. The conversion rate improves, but Average Order Value, gross margin and customer quality decline. A performance marketing team may optimize platform ROAS by concentrating spend on retargeting existing demand while new-customer acquisition slows.
The metric improves. The growth engine weakens.
A strong data-driven growth strategy therefore requires businesses to ask not only whether a KPI increased, but whether the movement improved revenue quality, profitability, customer value or sustainable growth.
Many businesses describe themselves as data-driven because they review dashboards before making decisions. That definition is incomplete.
A business becomes genuinely data-driven when data consistently improves how it identifies problems, evaluates options, prioritises resources and measures outcomes.
A data-driven growth strategy is a structured approach that uses connected business data to identify meaningful performance changes, diagnose their likely causes, estimate their commercial impact and prioritise the actions most likely to improve growth.
This process involves more than tracking KPIs. It connects reporting with reasoning and reasoning with action.
Data collection tells the business what information is available. Reporting organises that information. Analytics identifies patterns. Diagnostic analysis investigates why those patterns occurred. Decision intelligence evaluates what the findings mean for the business and what should happen next.
Most ecommerce companies invest heavily in data collection and reporting. They install more tracking tools, build larger dashboards and automate weekly reports. However, the responsibility for interpretation remains manual.
The founder or Growth Head must still decide which metric matters, whether the change is significant, what caused it and which team should respond.
That unresolved work is the insight-to-action gap.
Businesses experiencing this problem do not necessarily need another report. They need a system that helps them stop drowning in data and start making decisions.
Data fragmentation occurs when the information required to understand one business outcome is distributed across multiple platforms, teams and measurement systems.
Revenue may be recorded in Shopify. Traffic behaviour sits in GA4. Advertising costs are split between Meta Ads and Google Ads. Customer retention information appears in a CRM or messaging platform. Product profitability may exist in a finance spreadsheet, while inventory information sits in a warehouse system.
Each source describes one part of the business. Growth decisions, however, rarely belong to only one part.
Shopify’s guidance on ecommerce data integration explains that integrations connect systems such as storefronts, inventory, fulfilment, marketing and finance so that information can move between them rather than remaining in separate silos.
Connecting those systems is essential, but data integration alone does not guarantee decision clarity. A business can centralise every source in one dashboard and still leave the user facing hundreds of charts.
Data centralisation solves the access problem. Decision intelligence must solve the interpretation problem.
Customer Acquisition Cost is a simple example.
Meta Ads may calculate CAC using Meta-attributed conversions. Google Ads may calculate it using Google-attributed conversions. Shopify provides total orders but does not automatically determine which channel created each incremental customer. Finance may calculate blended CAC using total advertising spend, agency costs and actual new customers.
All four numbers can be technically correct because they answer different questions.
The problem begins when teams treat them as interchangeable.
A platform may report an efficient CAC while the brand’s blended acquisition cost is increasing. Platform ROAS may appear healthy while total revenue remains flat. Revenue may rise while contribution margin declines because the growth was generated through discounts, high return rates or low-margin SKUs.
The correct interpretation requires context across marketing, sales, customer and finance data.
This is why founders should evaluate CAC in relation to customer lifetime value rather than treating acquisition cost as an isolated performance score.
Individual metrics are useful for monitoring, but they are dangerous when used as complete explanations.
An ecommerce business is a connected system. Traffic affects conversion. Conversion affects acquisition efficiency. Product mix influences Average Order Value and margin. Inventory affects campaign performance. Retention affects the amount a business can afford to spend on acquisition.
A metric should therefore be interpreted alongside the variables that influence it.
Imagine that Meta Ads ROAS increases from 3.6 to 4.2. On the surface, the campaign appears more efficient.
During the same period, however, the brand increases its discount, sells a higher proportion of low-margin products, experiences more returns and attracts customers who do not purchase again. Platform-reported revenue rises faster than ad spend, but contribution margin weakens.
The advertising dashboard is not necessarily wrong. It simply does not contain enough information to determine whether the growth is profitable.
A more useful ROAS analysis would consider gross margin, contribution margin, discounting, returns, blended acquisition cost and customer lifetime value. This is also why a structured ROAS optimisation checklist should extend beyond a single platform’s reported return.
A D2C brand can increase revenue rapidly by offering a heavy first-order discount. The campaign generates more orders and may even reduce reported CAC because conversion improves.
However, those customers may have low repeat-purchase intent. If retention falls, the business must repeatedly pay to replace customers instead of building cumulative customer value.
The brand appears to be growing, but the economics underneath the growth are deteriorating.
This is why acquisition and retention cannot be managed as separate conversations. The appropriate balance between customer retention and acquisition depends on how much value acquired customers create after their first order.
Conversion rate is another metric that can be improved in ways that do not strengthen the business.
A site-wide discount may move conversion from 2.1% to 2.8%, but Average Order Value may fall by 20%. Existing customers who would have purchased at full price may also use the offer, reducing margin without creating incremental demand.
The higher conversion rate is real. The conclusion that the business has improved is not necessarily valid.
The correct question is not whether conversion increased. It is whether the increase generated additional profitable revenue.
A product may become the highest-revenue SKU in the catalogue while producing limited profit.
It may have a high return rate, expensive fulfillment, frequent discounting or weak cross-sell potential. It may also absorb a disproportionate amount of customer service time or attract one-time buyers who never return.
Revenue identifies sales volume. It does not determine product value.
SKU-level performance should therefore connect revenue with margin, return behaviour, inventory turnover and customer retention.
Your business does not need more disconnected metrics. It needs clearer priorities.
Decision intelligence in ecommerce is the use of connected data, analytical models, business rules and AI-assisted reasoning to explain performance changes, estimate their commercial importance and recommend prioritised actions.
It moves beyond reporting what happened and focuses on the decision that follows.
A useful decision-intelligence system should help a team understand what changed, why it may have changed, how much the issue matters and what should be investigated or acted upon first.
Business intelligence traditionally focuses on organising, visualising and exploring business data. It helps users understand historical and current performance.
Decision intelligence extends that process by incorporating diagnostic reasoning, impact assessment, prioritisation and recommended action.
|
Capability |
Traditional Dashboard or BI |
Netsights – Decision Intelligence |
|
Primary purpose |
Display and explore performance |
Improve a business decision |
|
Main question |
What happened? |
Why did it happen, and what should happen next? |
|
Data view |
Reports and channel-level metrics |
Connected cross-channel context |
|
Analytical depth |
Primarily descriptive |
Diagnostic, predictive and prescriptive |
|
User responsibility |
Interpret findings manually |
Review prioritised insights and actions |
|
Alerts |
Based on fixed thresholds |
Based on context, urgency and impact |
|
Typical output |
More information |
Decision-ready direction |
Traditional dashboards remain useful. They support reporting, exploration and performance monitoring.
The limitation appears when businesses expect descriptive visibility to automatically produce diagnosis and action. The difference between an ecommerce dashboard and an AI Scaleboard lies in how effectively the system moves from performance reporting to decision support.
A mature analytics process moves through several levels of understanding.
IBM’s analytics framework distinguishes between descriptive analytics, which explains what happened; diagnostic analytics, which investigates why it happened; predictive analytics, which estimates what may happen next; and prescriptive analytics, which recommends what should be done.
Descriptive analytics tells a business that revenue declined, CAC increased, conversion weakened or repeat purchases fell.
This information is essential because a team cannot respond to a performance change it has not detected. However, descriptive reporting identifies the result rather than the cause.
Diagnostic analytics examines connected variables to determine what may have contributed to the result.
If revenue declines, the investigation may include qualified traffic, checkout conversion, Average Order Value, product availability, payment success, campaign performance and returning-customer revenue.
The purpose is to reduce the number of plausible explanations and direct the team towards the most likely causes.
Predictive analytics uses historical patterns and current performance to estimate future outcomes.
In ecommerce, it can support revenue forecasting, stockout prediction, churn risk, campaign planning and demand estimation. These forecasts do not guarantee an outcome. They help the business prepare for a likely range of outcomes.
Prescriptive analytics recommends a possible response.
Instead of stating that blended CAC increased by 18%, it may explain that paid spend grew faster than new-customer orders and recommend reviewing campaign allocation before increasing the budget further.
The objective is not to replace executive judgement. It is to ensure that executive attention is spent evaluating meaningful actions rather than manually locating the problem.
A better growth strategy begins by reversing the usual approach.
Instead of asking, “What else can we track?” the business should ask, “Which decisions are we trying to improve?”
The purpose of integration should not be to create the largest possible database. It should be to connect the information required for important decisions.
A decision about advertising efficiency may require spend, new-customer orders, contribution margin and repeat behaviour. A decision about conversion may require traffic quality, device performance, checkout activity, payment failures and inventory availability.
The data model should reflect how the business actually operates.
Before automating analysis, the business must agree on what its metrics mean.
Revenue should be consistently classified as gross, net or contribution-based. CAC calculations should clearly state whether they include only ad spend or total acquisition costs. Blended ROAS should use the same revenue and spend definitions across reporting periods.
Without consistent metric logic, a unified dashboard merely brings conflicting calculations into the same screen.
Daily ecommerce performance naturally fluctuates.
A useful analytical system should differentiate between normal variation, seasonal patterns, temporary movement and a material anomaly.
This is especially important for alerts. When every small change generates a notification, users gradually stop paying attention. Effective real-time business reporting should reserve urgent alerts for issues that are significant, actionable and commercially relevant.
An anomaly is not a diagnosis.
When revenue falls, the system should evaluate the variables that can reasonably explain the movement. If traffic remained stable but mobile checkout conversion declined after a payment update, the evidence points towards a conversion or payment issue rather than an acquisition problem.
Root-cause analysis should narrow the investigation and show the evidence supporting each likely explanation. It should not present correlation as proven causation.
A 20% decline in a small campaign may be less important than a 3% checkout decline affecting the entire store.
Issues should be ranked according to revenue at risk, margin exposure, wasted spend, customer impact, urgency and effort required.
This converts analytics into a prioritisation system rather than a collection of warnings.
Generic recommendations create little value.
“Improve conversion rate” is not decision-ready.
“Mobile checkout completion declined after the latest payment-page update; investigate payment errors before increasing paid traffic” provides a problem, supporting context and a logical next step.
The recommendation should be specific enough to assign to an owner and measurable enough to review afterwards.
Every action should create organisational learning.
The business should record what changed, why the action was selected, what result was expected and what happened afterwards. Over time, this process improves both the analytical system and the judgement of the team using it.
A data-driven growth strategy becomes valuable when it creates a repeatable loop between information, decision, action and learning.
AI is useful in ecommerce analytics because it can continuously compare more variables than a person can manually review.
Its value does not come from producing another layer of generic summaries. It comes from reducing the analytical work required to identify meaningful patterns and business risks.
AI-powered ecommerce analytics can monitor revenue, conversion, acquisition cost, product performance, retention and inventory simultaneously.
It may identify that website traffic is stable while checkout conversion is falling, or that platform ROAS remains strong while blended ROAS and contribution margin are weakening.
These connected observations are more useful than an isolated notification that a single KPI moved.
When a performance problem appears, AI can compare related variables and rank plausible explanations.
A revenue decline may coincide with a mobile payment failure, a high-volume SKU stockout and lower repeat-customer activity. The system can surface these relationships and direct the team towards the evidence that deserves investigation.
However, AI should not claim certainty where the data only establishes correlation. Reliable decision intelligence requires clean data, business context and human review.
Founders do not always think in dashboard filters. They think in business questions.
They want to ask why revenue declined, which campaign is affecting blended ROAS, whether the business is likely to meet its target or which product is leaking margin.
Conversational analytics reduces the distance between asking the question and locating the relevant evidence. Netty supports this conversational approach by enabling natural-language questions grounded in ecommerce performance data.
Move from asking “What happened?” to know “What should we do next?”
Consider a hypothetical D2C apparel brand whose daily revenue declines by 12%.
Shopify reports fewer completed orders. GA4 shows stable traffic but lower mobile checkout completion. Meta Ads ROAS remains stable, while Google Ads spend is unchanged. The payment system records an increase in failures, and inventory data shows that a high-volume product has gone out of stock.
A collection of dashboards presents these as separate facts.
A decision-intelligence system should connect them into a prioritised explanation.
The first priority would be investigating mobile payment failures because stable traffic combined with weaker checkout completion suggests that demand is reaching the store but not converting successfully.
The second priority would be addressing the stockout. Advertising or organic landing pages may still be directing high-intent users towards an unavailable product, creating lost revenue and wasted acquisition spend.
The third issue would be the decline in repeat-customer revenue. That may not explain the entire daily movement, but it can increase the brand’s dependency on paid acquisition and weaken overall profitability.
The recommended response would be to audit payment errors, pause or redirect demand from the unavailable SKU, surface relevant product alternatives and review the affected returning-customer segments.
No additional dashboard was required.
The business needed the existing information to be connected, interpreted and prioritised.
Netsights is designed as an ecommerce decision-intelligence platform for founders, revenue leaders and growth teams.
Rather than functioning only as another reporting dashboard, the Netsights AI Scaleboard is intended to connect ecommerce performance information and present it through decision-ready Sights and Intelligence Cards.
The objective is to help teams understand what changed, what may have caused it, what the potential commercial impact could be and which action deserves attention.
iSight is designed to help teams explore ecommerce performance, identify anomalies, investigate root causes and understand trends across connected data.
This makes it possible to move beyond viewing an isolated revenue or ROAS change and examine the factors contributing to it.
Netification focuses on surfacing important performance changes without requiring teams to continuously monitor every dashboard.
The purpose is not to notify users about every fluctuation. It is to highlight risks, opportunities and cost-of-inaction signals that may require attention.
Netty allows leadership teams to ask natural-language questions about business performance.
Instead of manually opening several reports, a founder can ask why revenue changed, which channel affected performance or what issue deserves immediate investigation.
Together, these capabilities support a shift from unified ecommerce analytics towards unified ecommerce intelligence.
From fragmented reports to faster, clearer growth decisions.
Before investing in another dashboard, founders should evaluate whether the platform improves a decision or simply displays more information.
The platform should be able to connect marketing, revenue, customer, product and operational data rather than creating another channel-specific view. It should explain why a KPI may have changed, not merely highlight the movement. It should also help the team distinguish between a minor fluctuation and a material business risk.
The quality of its metric definitions should be auditable. Users should understand which data sources were used, how the KPI was calculated and why a recommendation was generated.
Most importantly, the platform should help the team determine what happens next.
If the output still requires the founder to manually reconcile six reports before acting, the business has purchased visibility rather than intelligence.
More data will not solve an ecommerce growth problem if the business still cannot determine what changed, why it changed, why it matters and what should be done next.
A stronger data-driven growth strategy does not attempt to collect every available metric. It connects the information that matters, applies consistent definitions, detects meaningful changes, investigates likely causes and prioritises action according to business impact.
Dashboards remain useful for visibility and exploration. However, visibility alone does not create growth.
Growth comes from making the right decision early enough to influence the outcome.
For D2C founders and ecommerce leaders, the competitive advantage is no longer access to data. Almost every business has access to data.
The advantage lies in turning that data into clear, timely and commercially relevant action.
Start using Netsights to convert fragmented ecommerce data into decision-ready growth intelligence.
Stop collecting more reports. Start making better growth decisions.
A: More data does not improve growth unless it helps the business make a clearer decision. Fragmented reports often increase analysis time without identifying the right action.
A: A data-driven growth strategy uses connected business data to identify performance changes, diagnose likely causes and prioritise actions based on commercial impact.
A: Decision intelligence in ecommerce combines data, analytics, business context and AI-assisted reasoning to explain what changed, why it matters and what the business should do next.
A: Ecommerce analytics shows patterns and performance changes. Decision intelligence adds root-cause analysis, prioritisation, impact assessment and recommended actions.
A: Dashboard fatigue is caused by too many reports, conflicting metrics, frequent alerts and excessive manual interpretation. It leaves teams with more information but less clarity.
A: Founders should track net revenue, conversion rate, Average Order Value, blended CAC, blended ROAS, contribution margin, repeat purchase rate and Customer Lifetime Value.
A: AI can compare connected metrics, detect unusual changes and highlight likely causes such as payment failures, falling conversion, rising CAC, stockouts or weaker retention.
A: Ecommerce brands can turn data into decisions by connecting data sources, standardising metrics, identifying meaningful changes, diagnosing causes and assigning clear next actions.
A: Real-time data improves decisions only when the change is accurate, important and actionable. Too many alerts can create distraction and reactive decision-making.
A: Netsights connects ecommerce performance data, surfaces anomalies, supports root-cause analysis and helps teams move from fragmented reports to prioritised, decision-ready insights.
We write about growth, retention, and the numbers that actually predict what happens next for D2C brands. Have a topic you'd like us to cover? Get in touch .
Your ecommerce store already contains the answers. Learn how AI ecommerce analytics helps founders ask business questions, understand what changed and why, and move from scattered data to clearer decisions.
Your ecommerce store already contains the answers. Learn how AI ecommerce analytics helps founders ask business questions, understand what changed and why, and move from scattered data to clearer decisions.
Your ecommerce store already contains the answers. Learn how AI ecommerce analytics helps founders ask business questions, understand what changed and why, and move from scattered data to clearer decisions.