
A DTC brand can grow from $200,000 to $1 million in monthly revenue and still find itself with less cash available for inventory, marketing and expansion.
That situation may appear contradictory, but it is surprisingly easy to create. Customer acquisition becomes more expensive as the brand scales. Discounts get deeper to maintain conversion rates. Return volumes increase with order volume. Fulfilment contracts that worked at an earlier stage become inefficient, and additional software, agencies and team members gradually increase operating costs.
None of these changes may look serious in isolation. Together, however, they can quietly remove several percentage points from the company’s margins.
At $200,000 in monthly revenue, a two-percentage-point margin leak represents $4,000. At $1 million, the same leak costs the business $20,000 every month. Scaling has not caused the underlying problem, but it has multiplied its financial impact.
This is the growth trap many ecommerce founders discover only after revenue has accelerated.
Shopify continues to show higher sales. Meta Ads may still report an acceptable return on ad spend. Google Ads may be generating conversions, while GA4 shows rising traffic and healthy engagement. Individually, each platform appears to confirm that the business is progressing.
Yet the founder may still be unable to answer the questions that determine whether that progress is financially healthy:
Which products create the most contribution profit after returns and acquisition costs? Are new customers becoming more expensive to acquire? Is discount-led revenue improving long-term customer value, or is it only creating temporary order volume? Which channel attracts customers who purchase again? Why is revenue increasing while cash flow becomes more difficult to manage?
These are not merely reporting questions. They are profitability questions.
A traditional dashboard is usually designed to show what happened within one part of the business. A proper profit margin analysis must connect acquisition, sales, products, customers, fulfilment and operational costs to explain why profit changed.
McKinsey’s analysis of ecommerce profitability makes an important distinction: not all growth creates equal value, and unprofitable growth can actively destroy value rather than strengthen the business. Sustainable ecommerce growth therefore requires more than increasing the top line. It demands a coordinated view of margins, customer economics, operating costs and channel performance.
That is the purpose of a profit margin audit.
A profitability audit examines how money moves through the business, from the initial sale to the profit ultimately retained. It identifies the difference between revenue that looks impressive on a dashboard and revenue that genuinely strengthens the company.
For ecommerce founders, growth teams and performance marketers, this changes the central question from:
How can we generate more revenue?
to
Which revenue should we grow, and how much profit will remain after we generate it?
This guide examines the seven hidden leaks that most commonly damage ecommerce margins. Before analysing those leaks individually, however, it is important to understand what a profitability audit includes and how the different layers of profit connect.
At its core, a profitability audit is about drilling down beneath the surface of the profit-and-loss statement to understand precisely what’s helping – or hindering – overall profit.
Anyone can look at a financial statement and tell you that a business generated a certain amount of revenue and a certain profit. But a P&L doesn’t tell you why the net profit declined or increased. It also doesn’t tell you whether that gain was sustainable.
A profitability audit seeks to figure out the “why” behind any fluctuations in a business’s profit margins.
– Was product mix skewing towards less profitable items?
– Were discount levels or customer acquisition costs rising too quickly?
– Was there a spike in return rates?
Perhaps shipping costs started increasing or a high-profile marketing campaign attracted a lot of first-time buyers who never returned.
Such trends are often analyzed in isolation. The beauty of a profitability audit is that it ties them all back together in relation to their impact on the bottom line.
For example, imagine a DTC apparel company doubles its monthly sales from $400,000 to $750,000. Seems like a home run, right? However, digging reveals that the average discount went up from 12 percent to 21 percent, the average customer acquisition cost went from $38 to $57 and returns went up as the brand entered more accessible markets with broader appeal.
Sales are up 87.5%, but the company has been keeping much less money in its pocket after each sale.
A typical sales report might highlight the additional $350,000 in revenue. A profitability audit asks: “How much did we keep out of that $350,000, after product cost, shipping, returns, acquisition cost, marketing and overhead?”
There’s a crucial distinction here: this is not just about cutting costs. Reducing costs can often create new problems. For example, eliminating the cost of some high-quality customer support agents to boost savings could result in a higher number of refunds and churn.
Reducing the cost of creative content to keep costs down may affect ad performance down the road.
Swapping out one type of packaging for a cheaper alternative might save a few dollars at the item level but lead to higher damages.
A helpful profitability audit differentiates between genuine cost leakages and productive cost expenses. Productive costs support the customer experience, growth or efficiency of the company. Cost leakages represent margin loss without generating commensurate value in return.
In the end, a profitability audit should help you answer three practical questions:
– Where is revenue currently being generated with maximum efficiency?
– What costs are hurting profit?
– What changes would have the greatest positive impact on profit without stunting growth?
Finding the answers all hinges on understanding the flow of revenue as it transitions through the business on its way to profit.
Revenue is the most visible number in an ecommerce business, but it is only the first stage of the profitability journey.
An order passes through several economic layers before it contributes to the company’s bottom line:
Revenue → Net Revenue → Gross Margin → Contribution Margin → Profit After CAC → Net Profit
Each layer answers a different management question. Skipping one can create a misleading view of performance.
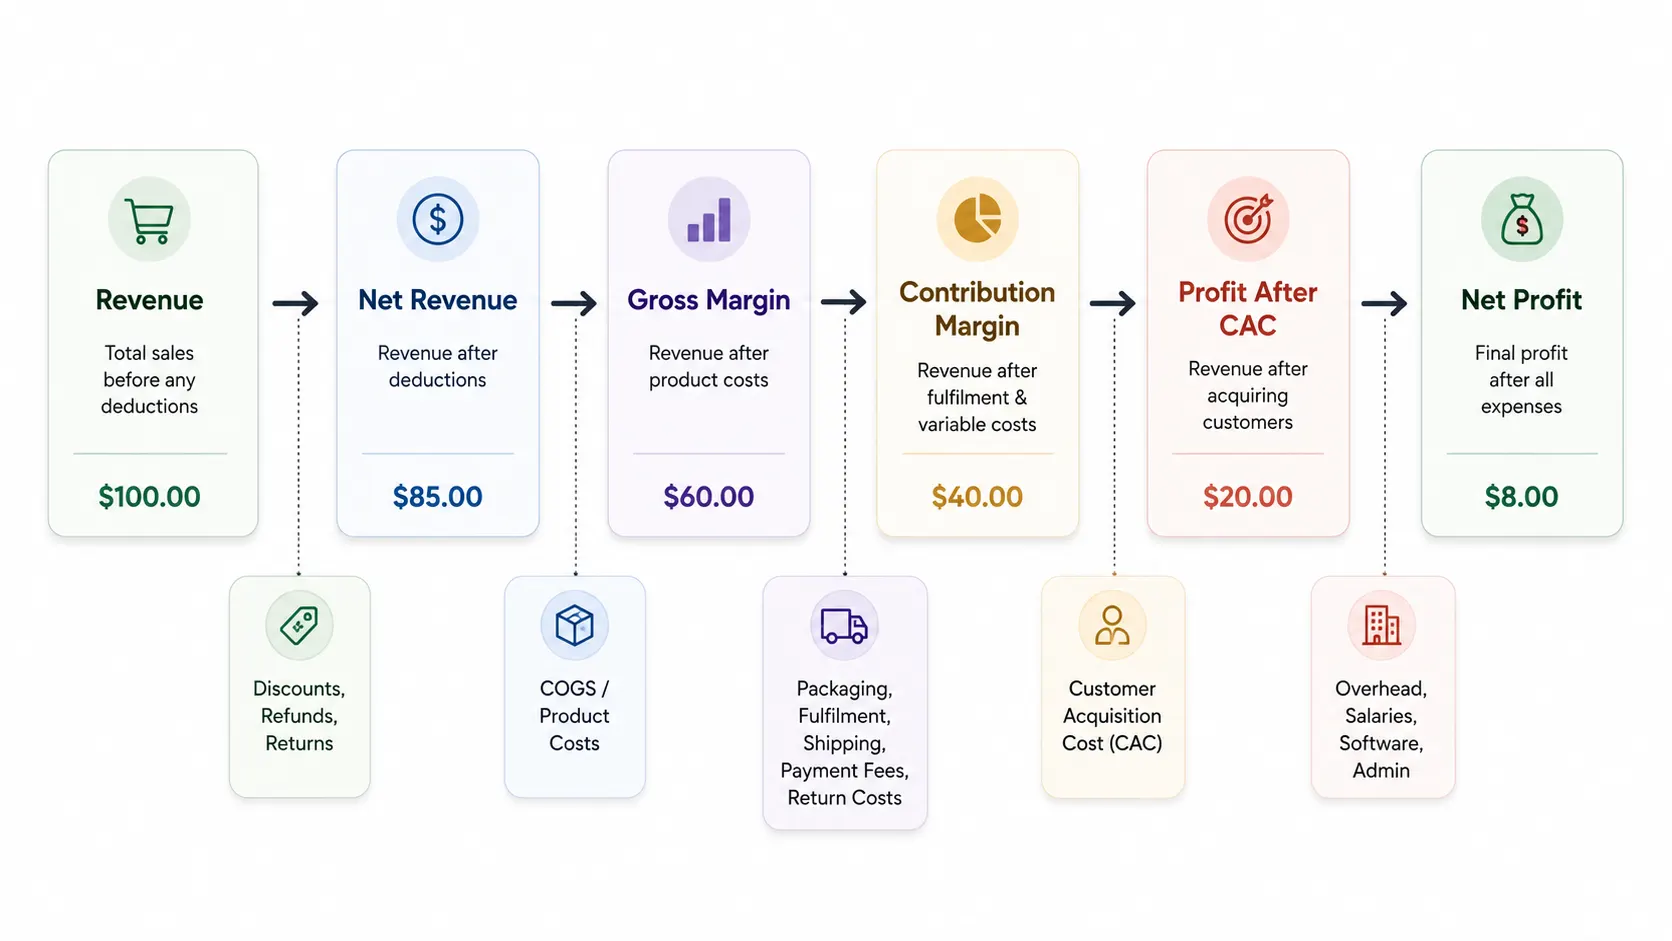
Revenue represents the total value of customer purchases, while net revenue shows what remains after discounts, cancellations, refunds and returns.
For example, a Shopify store generating $800,000 in gross sales may retain only $670,000 after $60,000 in discounts and $70,000 in returns.
This is why revenue growth should always be assessed alongside revenue quality. Two periods with similar sales can produce very different results depending on promotions, product mix and customer return behaviour.
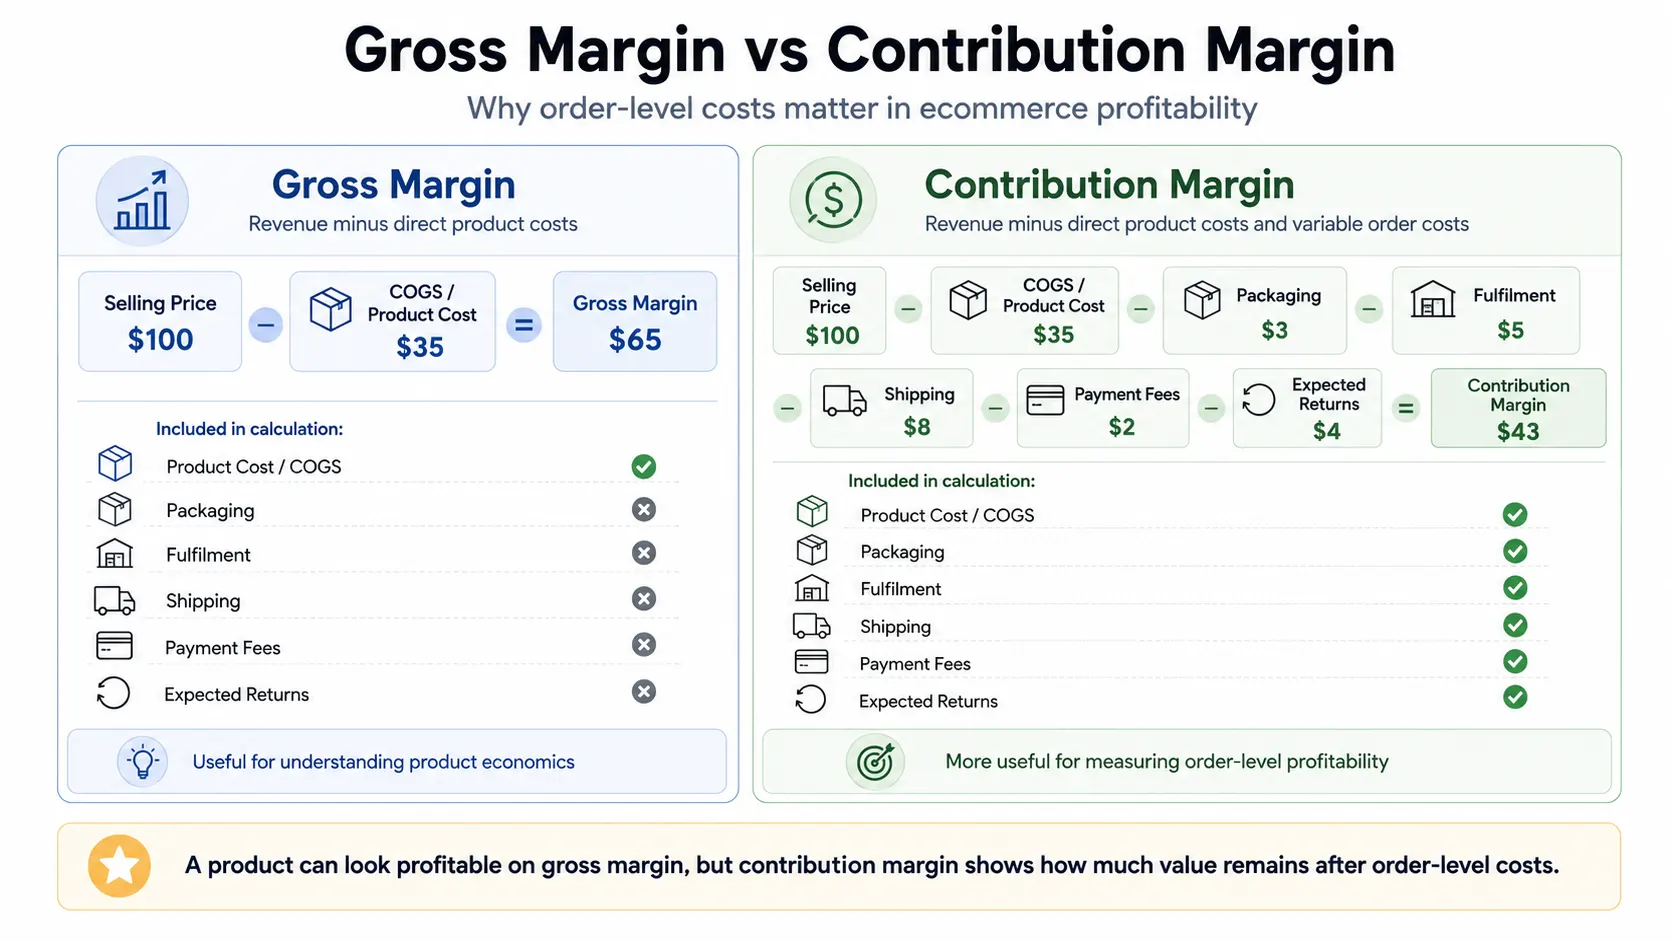
Gross margin shows how much revenue remains after deducting direct product costs.
A skincare product sold for $100 with a manufacturing cost of $32 generates $68 in gross profit and a 68% gross margin. This indicates whether the product has enough financial room to support fulfilment, advertising, customer service and overhead.
However, a healthy gross margin does not guarantee profitability. Shipping, payment fees, returns and customer acquisition costs can still significantly reduce the profit retained from each order.
Contribution margin provides a more practical view of ecommerce profitability because it deducts the variable costs required to complete an order.
An illustrative $100 order may look like this:
| Order component | Amount |
| Net selling price | $100 |
| Cost of goods sold | -$32 |
| Packaging | -$3 |
| Fulfilment | -$5 |
| Shipping subsidy | -$8 |
| Payment fees | -$3 |
| Expected return cost | -$4 |
| Contribution profit before CAC | $45 |
The order produces $68 in gross profit but only $45 in contribution profit after variable expenses.
If CAC is $30, the order retains $15 after acquisition. If CAC increases to $50, the same order loses $5 before overhead is considered.
This is why brands should not optimise marketing using revenue or platform ROAS alone. They must understand how much contribution remains after fulfilling and acquiring the order.
A deeper explanation of these economics is available in the guide to DTC unit economics that actually matters.
Net Margin considers the fixed and semi-fixed expenses of doing business such as salaries, rent, technology, professional and administrative expenses.
It indicates how much of the profit is left after servicing the customers and conducting the business operations.
While the contribution margin is important for analyzing products, campaigns, sales channels, and customer segments, net margin is important in assessing the financial situation of the entire business. A comprehensive profit margin audit must take into account both.
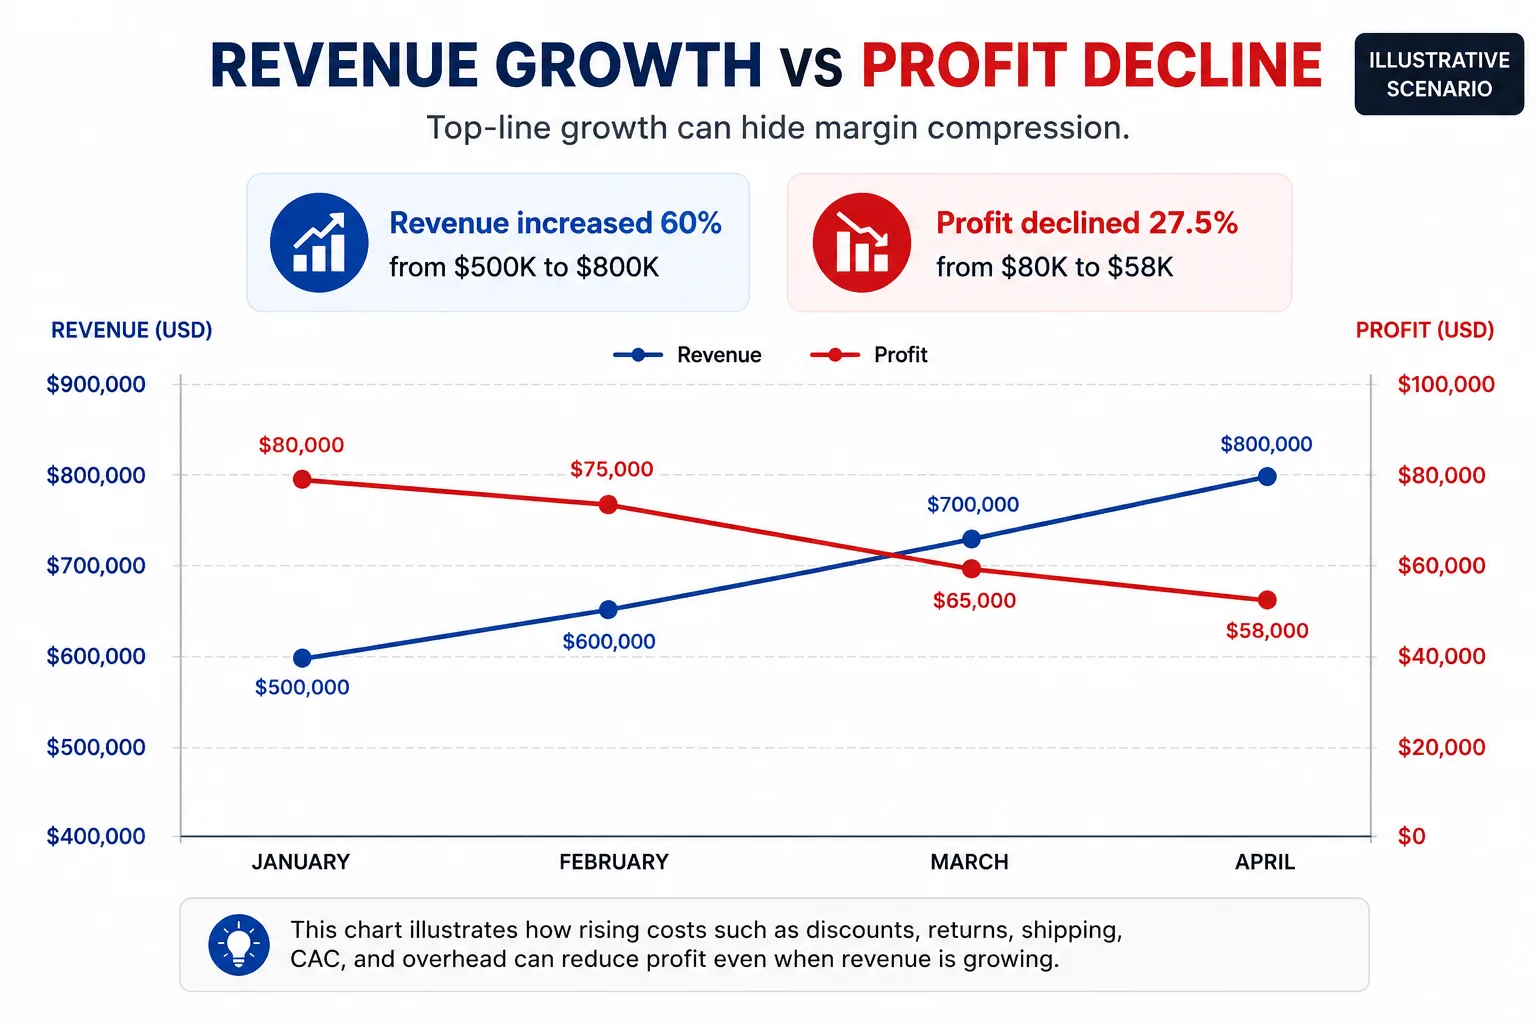
Revenue and profit can move in opposite directions.
That happens when the costs required to produce growth increase faster than the revenue itself.
Consider an illustrative DTC brand moving through an aggressive scaling period:
| Metric | January | April |
| Monthly revenue | $500,000 | $800,000 |
| Net contribution margin | 32% | 24% |
| Contribution profit | $160,000 | $192,000 |
| Marketing spend | $90,000 | $175,000 |
| Operating overhead | $52,000 | $68,000 |
| Estimated operating profit | $18,000 | -$51,000 |
Revenue increased by 60%, and contribution profit increased by $32,000. Yet the business moved from an estimated operating profit to a loss because acquisition spending and overhead expanded much faster.
This example is simplified, but the pattern is realistic. Growth can intensify weaknesses that were manageable at a smaller scale.
A return rate that increases by only three percentage points may affect thousands of additional orders. A small increase in fulfillment cost per order becomes significant when monthly volume doubles. An advertising channel can continue producing revenue even after its customers stop generating enough margin to recover acquisition costs.
Revenue dashboards rarely make these relationships obvious because the signals are spread across different systems.
Shopify may show higher sales. Meta Ads may report acceptable attributed ROAS. Google Ads may show more conversions. The fulfilment provider tracks shipping separately, while the finance team receives refund and payment-fee data later.
Every report may be technically correct, but no single report explains whether the combined economics are improving.
That is why profit margin analysis should compare growth in revenue with growth in contribution profit, acquisition spend, returns, fulfillment cost and overhead.
McKinsey’s ecommerce research describes this as the paradox of growth and profitability: digital growth alone does not necessarily produce greater earnings, and healthy growth requires a deliberate organisation-wide focus on profitable economics.
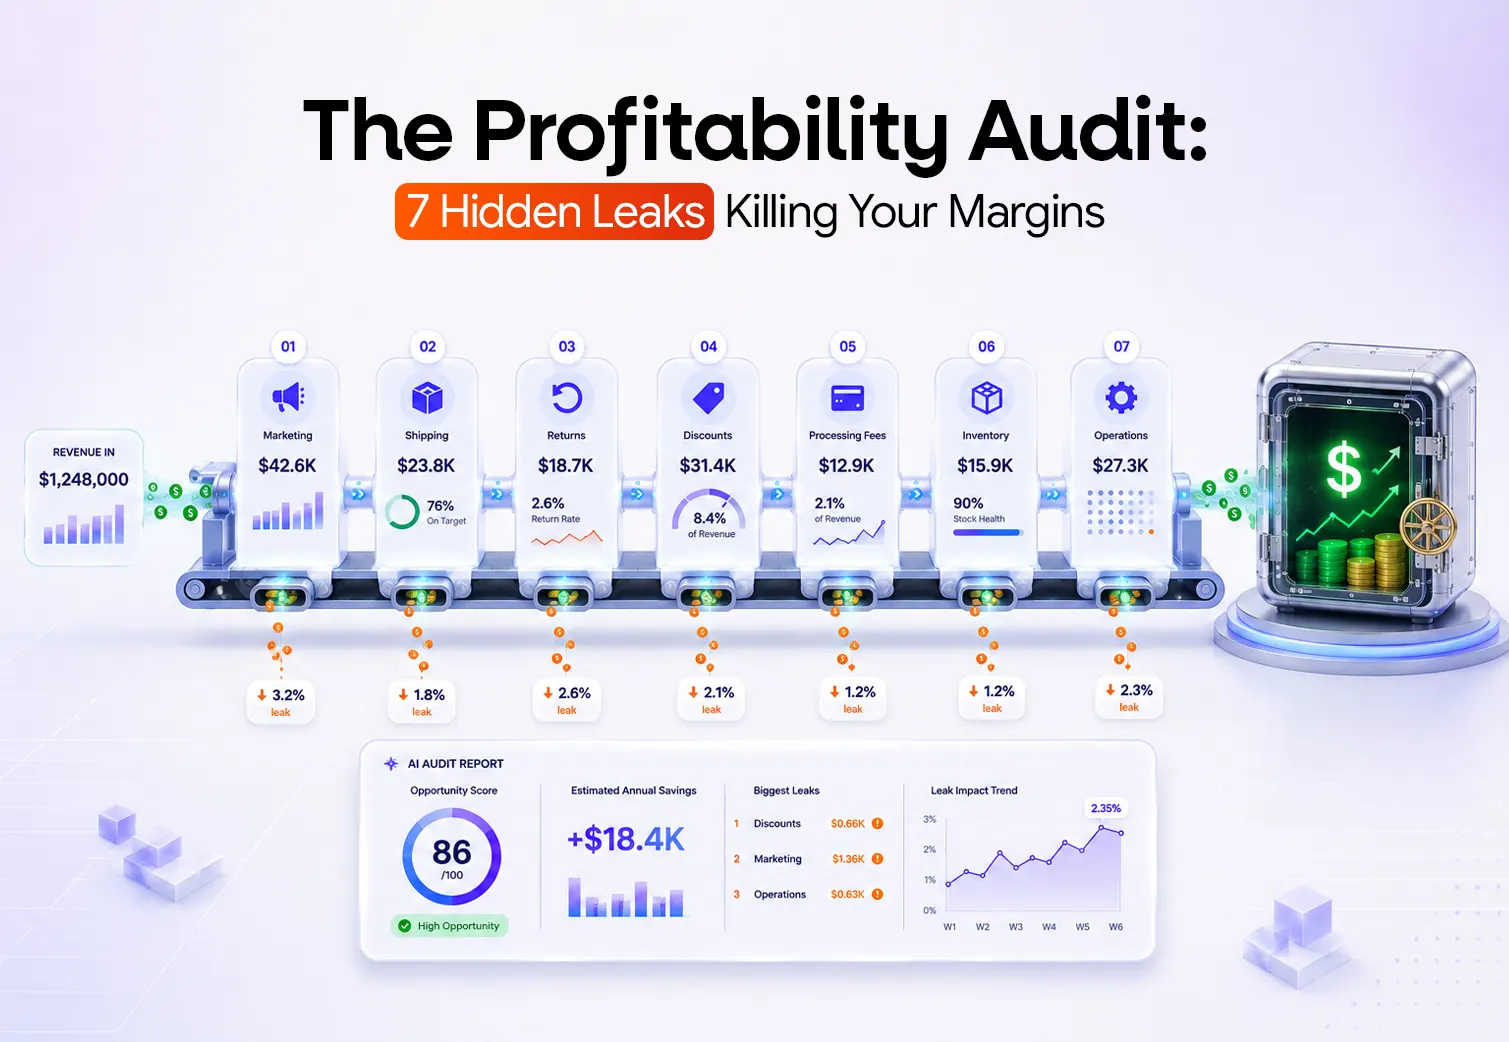
Profit rarely disappears because of one major issue. Smaller problems such as rising CAC, discounts, returns and operational costs often combine to weaken margins.
The following seven leaks commonly reduce ecommerce profitability as brands scale.
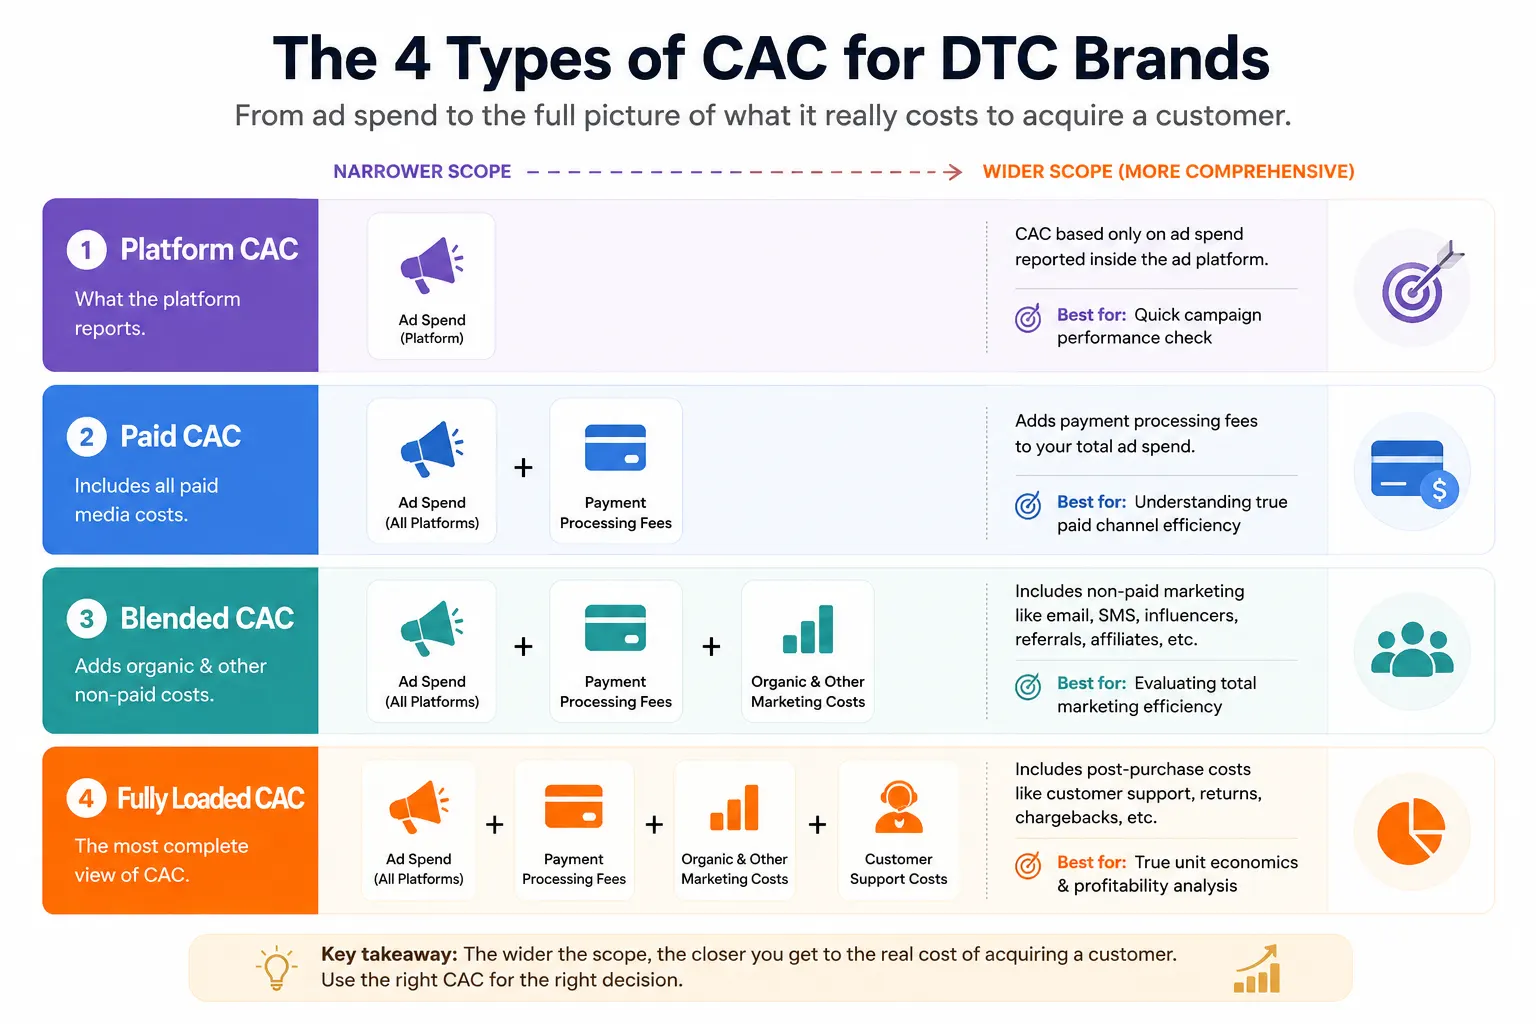
Customer acquisition cost becomes a profitability leak when a brand spends more to acquire customers without improving order value, retention or customer lifetime value.
Many brands calculate CAC using only advertising spend. A more accurate calculation should include related costs such as creative production, agency fees, marketing tools and promotional expenses. Shopify defines CAC as the total sales and marketing cost required to acquire a new customer, which makes a fully loaded view more useful than platform-reported acquisition costs alone.
For example:
If a brand spends $40,000 on advertising and another $10,000 on creative, tools and agency support to acquire 1,000 customers, its true CAC is $50, not $40. This difference can change whether the first order is profitable.
CAC should therefore be compared with contribution margin, repeat purchases and payback period, not revenue alone. Learn more in the Netsights guide to CAC vs LTV for DTC profitability.
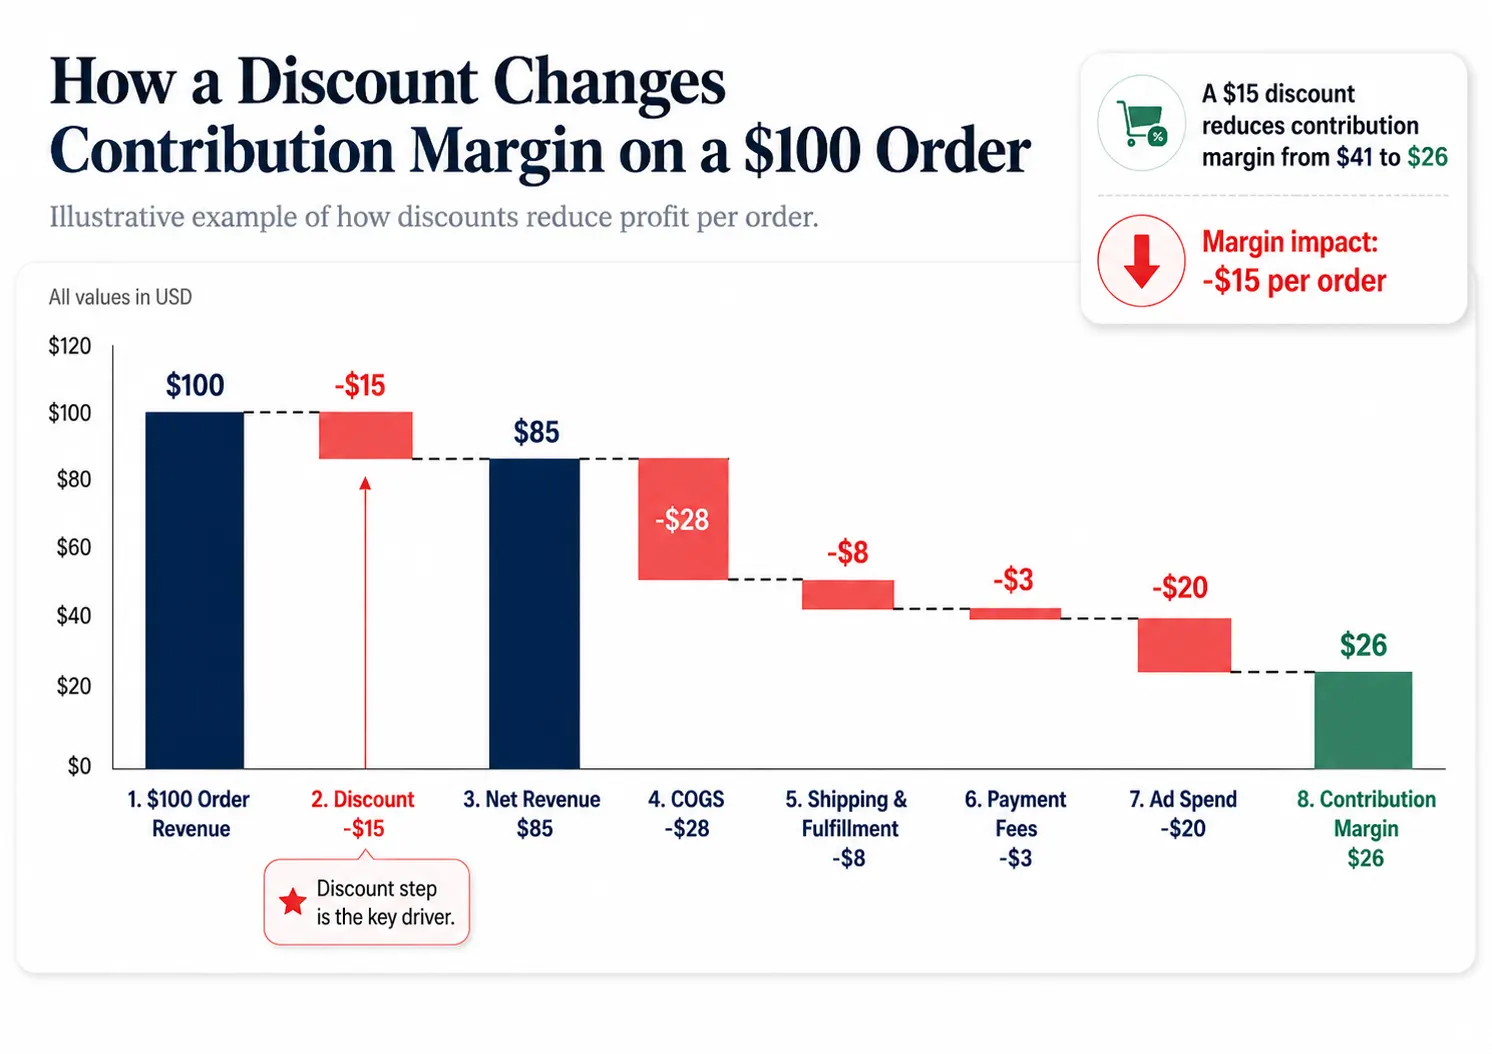
Discounts can increase conversion rates and generate short-term revenue, but frequent discounting may reduce the contribution earned from every order.
Consider an illustrative $100 order discounted by 20%. The brand receives $80 before product costs, fulfillment, payment fees, shipping and acquisition expenses are deducted. A campaign may still report strong revenue or ROAS even when very little profit remains.
Discounting becomes particularly risky when customers begin waiting for promotions before purchasing. This lowers full-price demand, weakens repeat-purchase quality and makes future revenue more dependent on offers.
Brands should compare the conversion lift generated by a discount with the margin lost per order. They should also evaluate whether bundles, minimum-spend offers or loyalty rewards could increase perceived value without reducing prices across the entire store. Shopify similarly recommends reviewing profit per order and gross margin after pricing changes, rather than judging them only by sales growth.
Are higher sales actually improving your margins?
Connect your ecommerce and marketing data to identify which campaigns, products and discounts are creating profitable growth.
Returns affect more than recorded revenue. A returned order may also create shipping costs, payment charges, warehouse handling expenses, damaged inventory and customer-support work.
The National Retail Federation estimated that 19.3% of online sales would be returned in 2025, showing why return-adjusted profitability matters for ecommerce brands.
A product that generates $100,000 in revenue may initially appear successful. However, if it has a high return rate and expensive reverse logistics, its retained revenue and contribution profit may be significantly lower.
Returns should be analysed by product, campaign, customer segment and reason. For example, a fashion product may have high sales but poor profitability because of sizing issues, misleading product images or customers purchasing multiple variants and returning most of them.
The objective is not to eliminate all returns. It is to identify avoidable returns and understand their financial impact before investing more in the affected products or campaigns.
High revenue does not always indicate a high-quality product portfolio. Some bestselling products generate limited profit because of low margins, heavy discounts, expensive shipping or high return rates.
For example:
Product A may generate $250,000 in revenue at a 16% contribution margin, while Product B generates $120,000 at a 42% margin. Product A is larger by revenue, but Product B may create more reliable profit and deserve greater marketing or inventory support.
Shopify’s profitability reporting allows merchants to examine profit and margin at product and order level, reinforcing the need to evaluate products beyond sales volume.
A product-level profitability audit should compare net revenue, gross margin, contribution margin, return rate, discount usage and acquisition cost. This helps brands decide which products to promote, reprice, bundle, improve or discontinue.
Product-level analysis is also a key part of understanding DTC unit economics because overall store averages can hide significant differences between products.
Marketing platforms are designed to report conversions, not complete business profitability. Meta Ads, Google Ads, Shopify and GA4 may attribute revenue differently because each platform uses its own data, attribution window and reporting method.
Google Analytics allows businesses to select and compare attribution models, which can change how conversion credit is distributed across marketing channels.
The deeper issue is that attributed revenue does not automatically equal profitable revenue. A campaign may report a strong ROAS while attracting customers who use large discounts, purchase low-margin products or rarely return.
Brands should connect attributed revenue with contribution margin, customer type, product mix, returns and repeat purchases. This changes the question from:
Which channel generated the most revenue?
to
Which channel created the most profitable customers?
This is the difference between conventional reporting and ecommerce decision intelligence, where marketing data is evaluated alongside commercial outcomes.
Operational costs often increase gradually as an ecommerce business grows. Shipping subsidies, fulfillment fees, packaging, payment charges, software subscriptions, warehouse labour and customer-support costs may each appear manageable, but together they can consume a large share of contribution profit.
McKinsey has reported that fulfillment costs can represent approximately 12% to 20% of ecommerce revenue in some business models, highlighting how quickly operational expenses can reduce profitability.
These costs should be measured per order, product, region and fulfilment method. A bulky product may be profitable in one location but unprofitable in another because of shipping costs. Similarly, free express delivery may increase conversion while reducing the final contribution retained from each order.
An operational audit should focus on cost trends rather than waiting for a major expense spike. Small increases in fulfillment cost per order can have a significant effect when multiplied across thousands of monthly orders.
The final leak is not a single cost. It is the delay between a profitability problem appearing and the business responding to it.
When Shopify, Meta Ads, Google Ads, GA4, customer data and operational reports are reviewed separately, teams may see that performance has changed without understanding why. By the time data is exported, meetings are completed and actions are approved, the brand may have already lost several days or weeks of profit.
For example, a campaign’s ROAS may decline because CAC increased, conversion rate fell or the product mix shifted toward lower-margin items. Treating every decline as a media-buying problem can lead to the wrong decision.
McKinsey’s work on ecommerce profitability similarly emphasises coordinated management of marketing investment, promotions and supply-chain costs rather than evaluating them independently.
Tools such as Netsights, iSight, Netification and Netty help connect these signals so teams can detect changes, investigate causes and prioritise the next action.
Find the leaks before they limit growth.
Bring your ecommerce, marketing and customer data together to understand what is affecting profitability and what deserves attention first.
A profitability audit can become unnecessarily complex when teams attempt to analyse every metric simultaneously. A more practical approach is to work from the broadest outcome towards the underlying drivers.
Agree on how the business calculates net revenue, gross margin, contribution margin, CAC and net profit.
Without consistent definitions, departments may report different versions of profitability. Document the costs included in each metric and apply the same logic across reporting periods.
Begin with gross sales and progressively deduct discounts, returns, COGS, variable order costs, acquisition and overhead.
This bridge makes the location of margin compression visible.
Compare the bridge across several months. The objective is not only to find the largest cost, but to identify which component is worsening.
Review profitability by product, channel, customer cohort, geography and promotion.
Business-wide averages are useful for financial reporting but rarely reveal where intervention is required.
A blended margin of 28% may contain a product at 50% and another at 8%. A blended CAC of $45 may combine one channel at $28 and another at $72.
Convert percentage changes into financial impact.
A two-point decline in contribution margin on $5 million in net revenue represents $100,000. A $6 rise in CAC across 20,000 new customers costs $120,000.
This prioritises action. Teams can focus on the leaks with the greatest business impact rather than the most visually dramatic dashboard movement.
Each leak should have an owner, an expected action and a review date.
Fast-moving metrics such as CAC, conversion, revenue and stock availability may require daily or weekly monitoring. Product margin, return behaviour and cohort profitability may be reviewed weekly or monthly depending on order volume.
The audit should become an operating discipline rather than a one-time finance project.
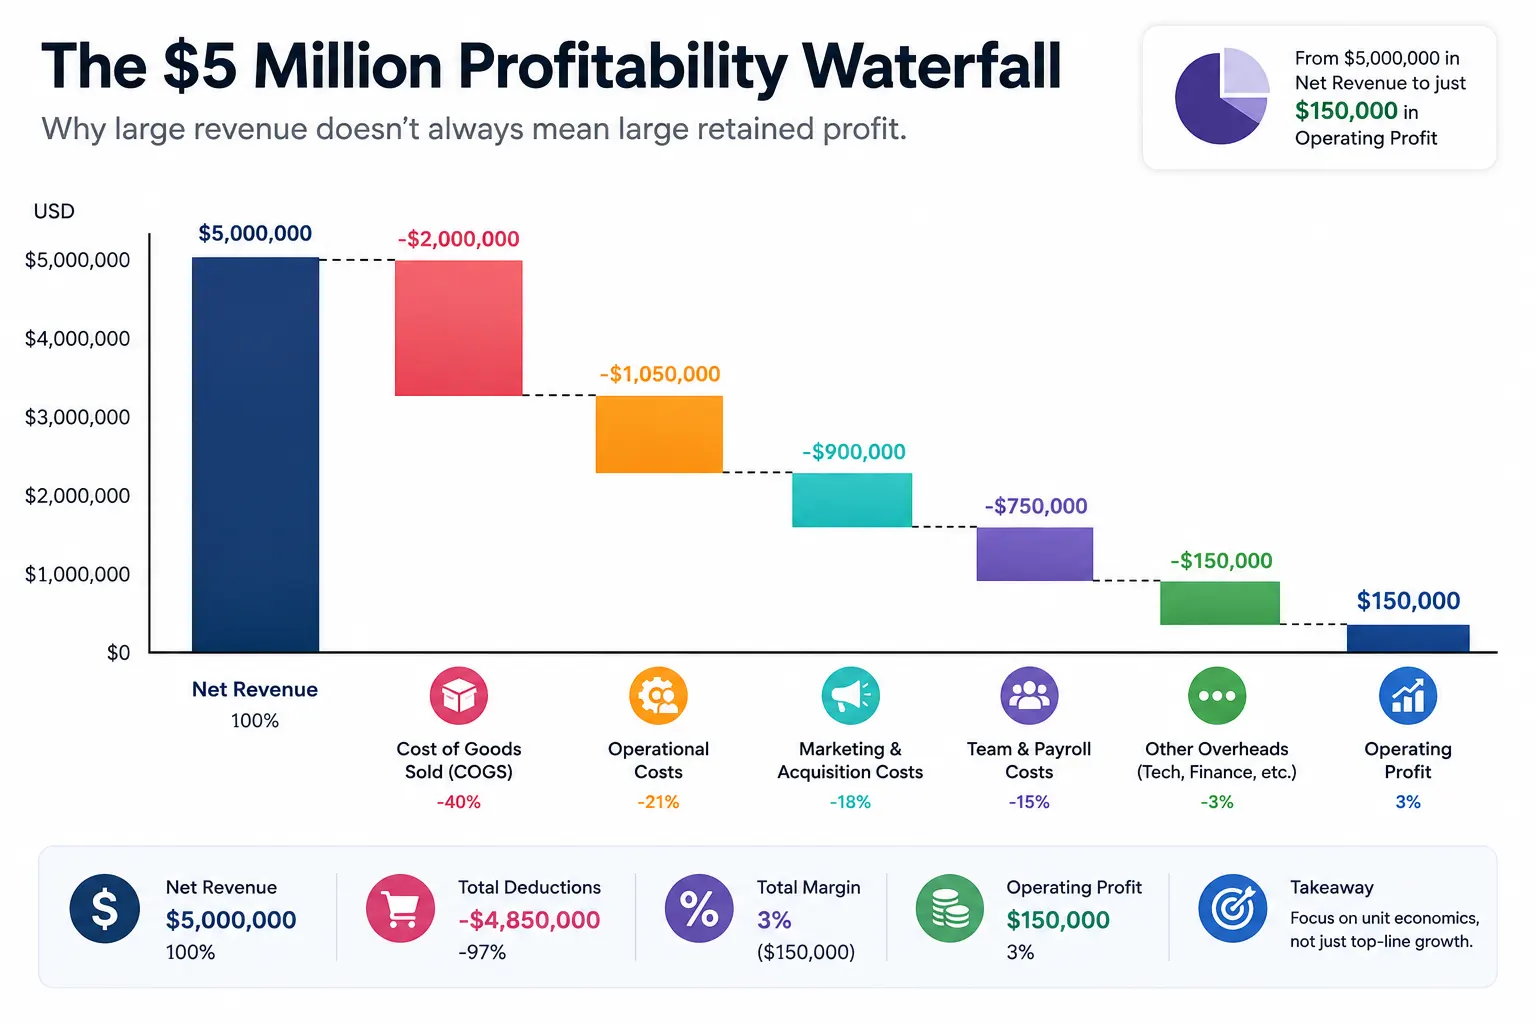
Consider a DTC brand generating $5 million in annual net revenue.
From the outside, it appears successful. A profitability audit reveals the following economics:
Profitability layer | Annual amount |
Net revenue | $5,000,000 |
Cost of goods sold | -$1,750,000 |
Gross profit | $3,250,000 |
Fulfilment, shipping, payment and return costs | -$700,000 |
Contribution before acquisition | $2,550,000 |
Fully loaded marketing and acquisition | -$1,800,000 |
Contribution after acquisition | $750,000 |
Payroll, technology and administration | -$600,000 |
Operating profit | $150,000 |
The company retains only 3% of net revenue as operating profit.
That does not automatically make the business unhealthy. Profit expectations depend on category, growth stage, working-capital needs and strategic priorities. The example illustrates how a business with millions in revenue can have limited room for error.
A three-percentage-point improvement in operating margin would add another $150,000 in annual profit without requiring additional revenue.
The improvement may come from several smaller actions rather than one dramatic cut:
A one-point improvement in product and discount margin, a one-point improvement in acquisition efficiency, and a one-point reduction in operational leakage collectively produce the same $150,000 impact.
The specific scorecard will vary by category, but most DTC businesses benefit from monitoring the following metrics together:
Metric | What it reveals |
Net revenue | Sales retained after discounts, refunds and returns |
Gross margin | Strength of product pricing and direct product economics |
Contribution margin | Profitability after variable order costs |
Fully loaded CAC | Complete cost of acquiring a new customer |
CAC payback period | Time required to recover acquisition cost |
Margin-based LTV | Customer value after relevant costs |
Repeat-purchase rate | Strength of retention and future revenue quality |
Return rate | Revenue and operational leakage |
Product contribution | Which SKUs create actual profit |
Contribution after CAC | Whether acquisition creates economic value |
These metrics should not be viewed as independent KPIs.
A rising AOV may be positive unless it comes from deeper discounts or lower-margin bundles. A lower CAC may be misleading if the customers have weak retention. A high LTV may be unreliable when it is based on revenue rather than contribution.
The purpose of the scorecard is to explain the relationship between the metrics, not simply collect more numbers.
Traditional dashboards remain valuable. Shopify, Meta Ads, Google Ads and GA4 each provide essential visibility into part of the ecommerce journey.
The limitation appears when founders must manually connect those reports to understand why profitability changed.
A dashboard may show that revenue fell by 12%. The team still needs to establish whether the cause was lower traffic, higher CAC, a conversion decline, stock availability, product mix, returns or weaker repeat demand.
Decision intelligence adds an interpretive layer above reporting.
Instead of only presenting the change, it aims to connect related signals, identify probable causes, estimate business impact and guide the team towards an action.
Netsights.ai positions its Scaleboard around this distinction. Its official product information describes connected intelligence across Shopify, Meta Ads, Google Ads, GA4 and other ecommerce systems, with blended metrics, anomaly-led insights and cost-of-inaction context.
iSight is positioned as an AI-powered revenue-intelligence engine that monitors performance metrics, detects anomalies, identifies root causes, forecasts revenue and recommends actions.
Within a profitability audit, this type of analysis can help teams move from observing that a metric changed to investigating the connected drivers.
For example, a decline in revenue may coincide with rising CAC, lower conversion and reduced availability of a high-contribution product. Reviewing those signals together creates a better starting point than reacting to the revenue figure alone.
Netification provides automated ecommerce KPI updates and alerts through channels such as WhatsApp and email. The objective is to surface material performance changes without requiring teams to inspect multiple dashboards throughout the day.
This is particularly relevant to profitability monitoring because the cost of a leak often increases with time. A campaign overspending for one day is less damaging than the same issue running unnoticed for three weeks.
Netty adds a conversational route to business analysis. Instead of searching reports manually, teams can ask questions about performance and use the resulting context to begin an investigation.
Conversational analysis does not replace financial judgment or operator experience. Its value lies in reducing the friction between noticing a problem and exploring the relevant data.
The broader goal is not to automate every decision. It is to give founders and growth teams a clearer, faster view of the issues that deserve human attention.
McKinsey reported in 2026 that its own Merchant AI Accelerator had seen gross-margin improvements of approximately two to three percentage points in participating implementations. That is a consulting-reported outcome rather than a universal benchmark, but it illustrates the potential value of combining data, technology and operating processes to improve commercial decision-making.
Turn scattered ecommerce data into profitable decisions.
Identify margin leaks, investigate root causes and understand which products, customers and channels deserve additional investment.
Revenue growth can hide weak economics for longer than most founders expect.
The business may continue acquiring customers, processing orders and reporting positive campaign results while rising CAC, discounts, returns, product-mix changes and operational complexity gradually reduce the profit retained from each sale.
A profit margin audit brings these signals into one connected view.
It shows whether revenue is high quality, whether product economics remain healthy, whether acquired customers generate enough long-term contribution and whether operations are becoming more efficient as the company scales.
Most importantly, it turns profitability from a month-end accounting result into an ongoing management discipline.
The goal is not to eliminate every cost or demand that every first order is immediately profitable. Growth requires investment, experimentation and sometimes deliberate short-term trade-offs.
The goal is to understand those trade-offs before they become hidden losses.
When founders can connect revenue, margins, CAC, retention, products and operations, they can make clearer decisions about what to scale, what to repair and what to stop.
Find the leaks. Fix the gaps. Grow profitably.
A: A profitability audit reviews revenue, costs, products, customers, and operations to identify where profit is created or lost. It helps businesses prioritise improvements across pricing, acquisition, returns, fulfilment, and operational efficiency.
A: Start with net revenue, subtract COGS to calculate gross margin, and then deduct variable order costs to find contribution margin. Review CAC, overhead, products, channels, and customer cohorts to identify margin leaks.
A: Profit may decline when CAC, discounts, returns, fulfilment, or overhead grow faster than revenue. A shift towards lower-margin products can also increase sales while reducing the amount of profit retained.
A: Common hidden costs include creative production, agency fees, shipping subsidies, payment charges, return handling, failed deliveries, software subscriptions, inventory holding, and manual reporting.
A: Gross margin deducts direct product costs from net revenue. Contribution margin also deducts variable order expenses such as packaging, fulfilment, shipping, payment fees, and expected returns.
A: DTC brands can improve margins by optimising product mix, reducing unnecessary discounting, lowering avoidable returns, improving acquisition efficiency, strengthening retention, and removing operational cost leakage.
A: Founders should track net revenue, gross margin, contribution margin, fully loaded CAC, CAC payback period, margin-based LTV, repeat-purchase rate, return rate, and product-level contribution.
A: AI can connect ecommerce, advertising, customer, and operational data to detect unusual changes and highlight likely causes. It helps teams identify issues such as rising CAC, declining conversion, return spikes, or weaker product margins faster.
We write about growth, retention, and the numbers that actually predict what happens next for D2C brands. Have a topic you'd like us to cover? Get in touch .
Your ecommerce store already contains the answers. Learn how AI ecommerce analytics helps founders ask business questions, understand what changed and why, and move from scattered data to clearer decisions.
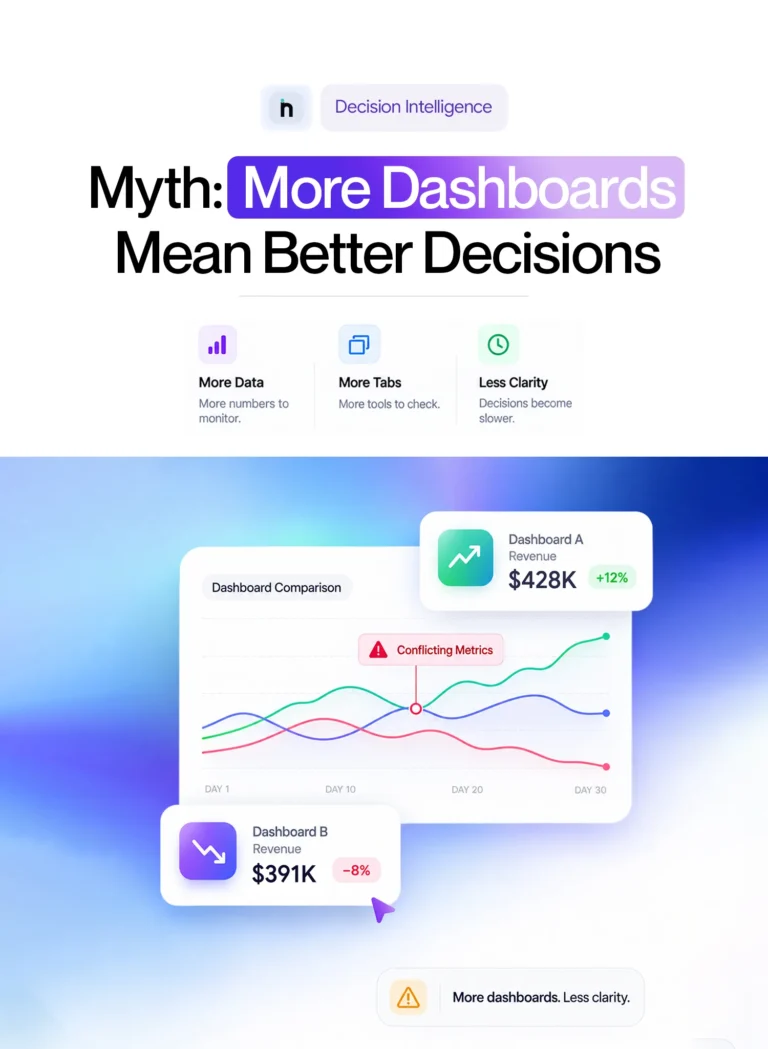
Your ecommerce store already contains the answers. Learn how AI ecommerce analytics helps founders ask business questions, understand what changed and why, and move from scattered data to clearer decisions.

Your ecommerce store already contains the answers. Learn how AI ecommerce analytics helps founders ask business questions, understand what changed and why, and move from scattered data to clearer decisions.