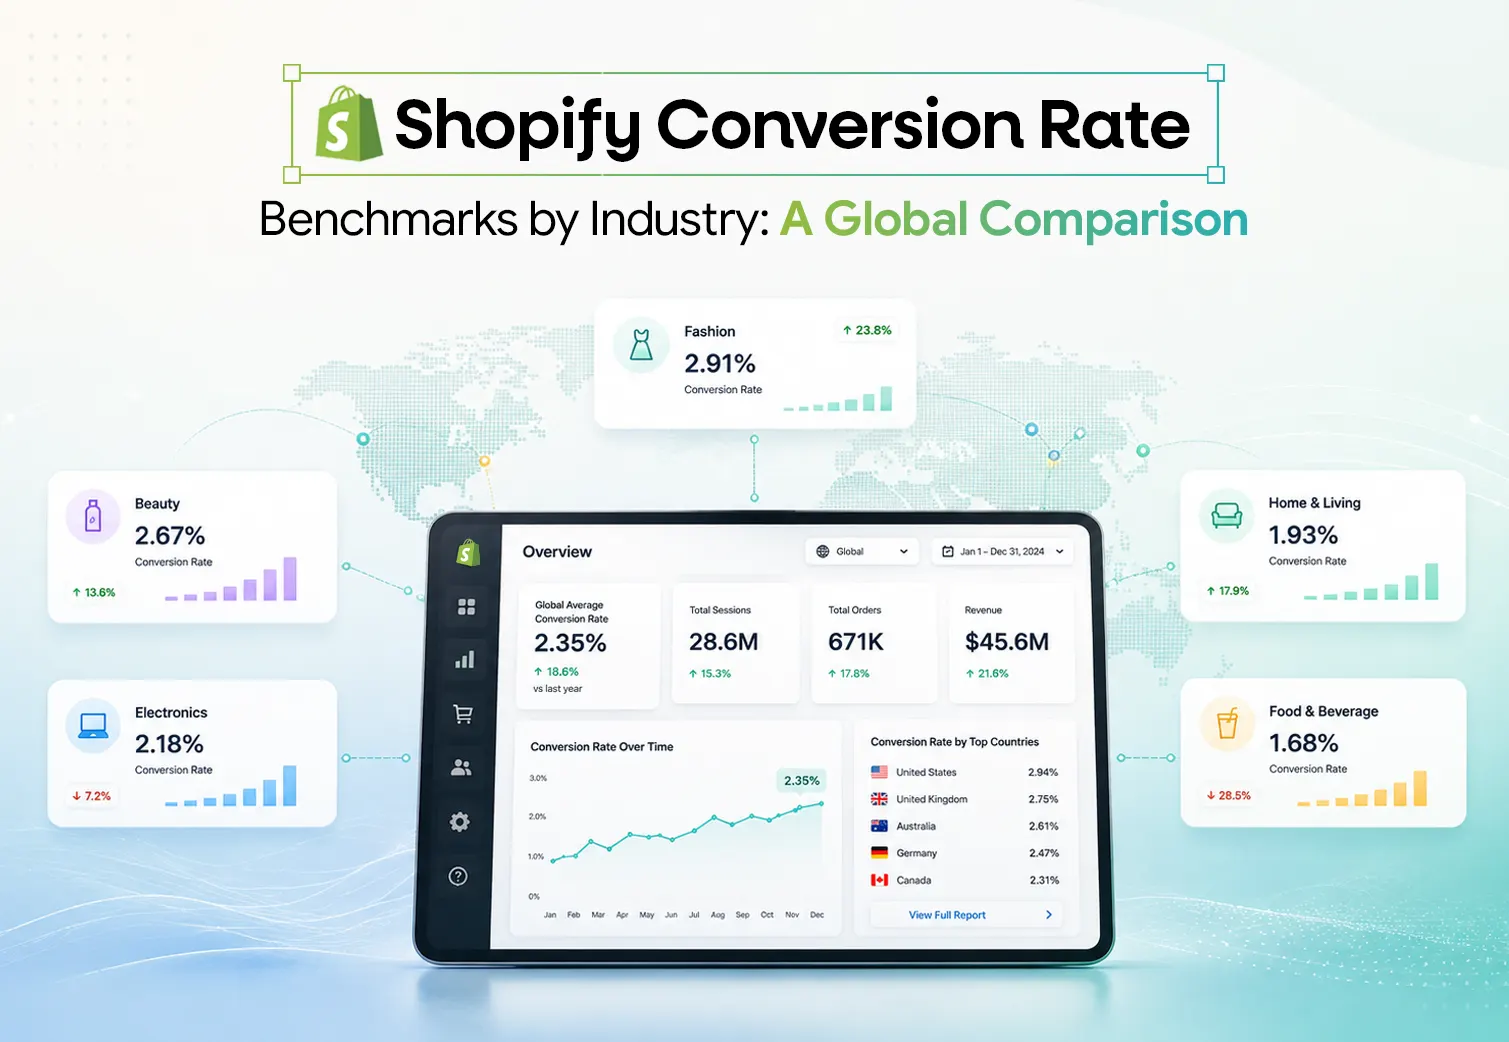
“Compare Shopify conversion rate benchmarks by industry, device, traffic source, and customer type, and see what a good conversion rate really looks like for your store.”
Traffic is getting harder to earn. That makes every visit more valuable.
Say your Shopify store gets 100,000 sessions a month. If conversion rises from 1.5% to 2%, you gain 500 extra orders without adding more traffic.
At a $70 average order value, that could mean $35,000 in extra monthly revenue.
But benchmarking is not that simple.
A beauty store, fashion brand, and luxury jewellery business can all have very different conversion rates and still be healthy. Price, purchase frequency, device mix, traffic source, customer intent, and market all shape the result.
So the better question is not:
“What is the average Shopify conversion rate?”
It is:
“What is a good Shopify conversion rate for a store like mine?”
Quick Answer: What Is a Good Shopify Conversion Rate in 2026?
For many ecommerce stores, a conversion rate between 1% and 3% can be a useful working range. A rate above 3% is strong for many categories, but there is no single target for every Shopify store.
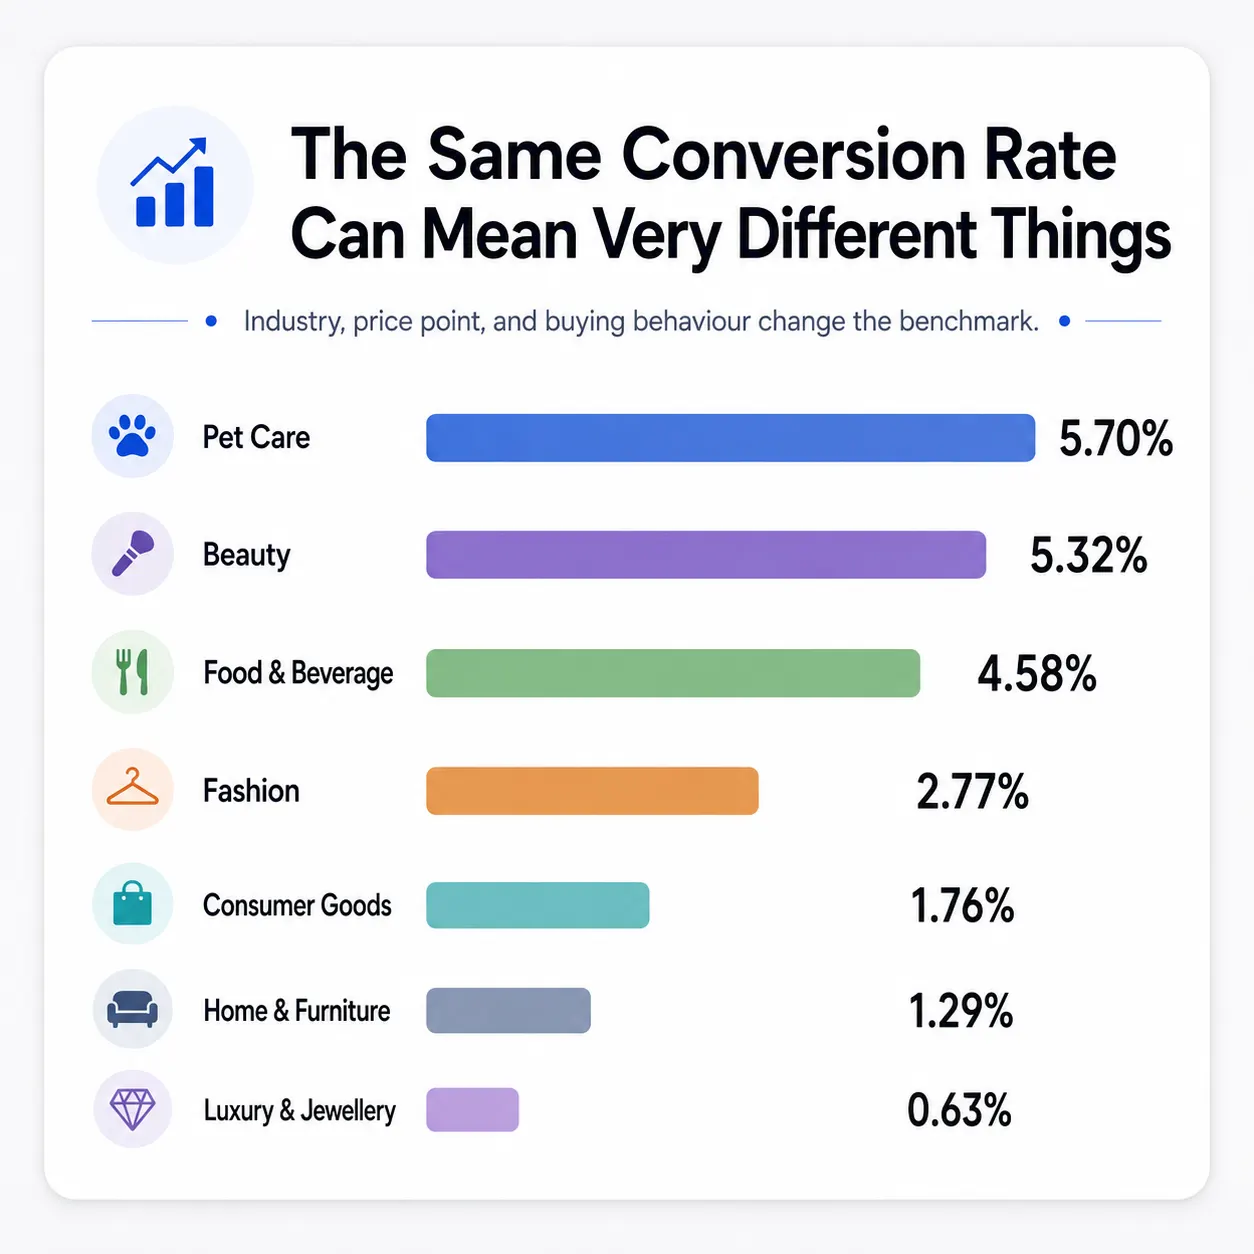
Current benchmarks show why. Shopify’s 2026 industry data ranges from 0.63% for luxury and jewellery to 5.70% for pet care and veterinary services.
The right benchmark depends on what you sell, how much it costs, who visits your store, and how those shoppers reach you.
Key Takeaways
- There is no universal Shopify conversion rate benchmark.
- Current global ecommerce conversion rates vary by dataset and method.
- Industry benchmarks can range from below 1% to above 5%.
- Mobile brings most traffic, while desktop still converts better.
- Returning visitors tend to convert better than new visitors.
- Storewide conversion rate should be read alongside AOV, CAC, ROAS, retention, and margin.
What Is Shopify Conversion Rate?
Shopify calls this metric online store conversion rate. It is the percentage of online store sessions that result in a purchase.
Shopify Conversion Rate = Sessions That Completed Checkout ÷ Total Online Store Sessions × 100
If your store gets 10,000 sessions and 200 of those sessions end in a purchase, your conversion rate is 2%.
Shopify also tracks sessions with cart additions, sessions that reach checkout, and sessions that complete checkout. These funnel metrics help you see where shoppers leave the buying journey.
For a deeper explanation of the metric, see NetSights’ ecommerce conversion rate guide.
A falling conversion rate does not tell you what went wrong. The problem could start on the product page, in the cart, at checkout, or before the shopper even lands on your site.
What Is the Average Shopify Conversion Rate in 2026?
There is no single current number that represents every Shopify store.
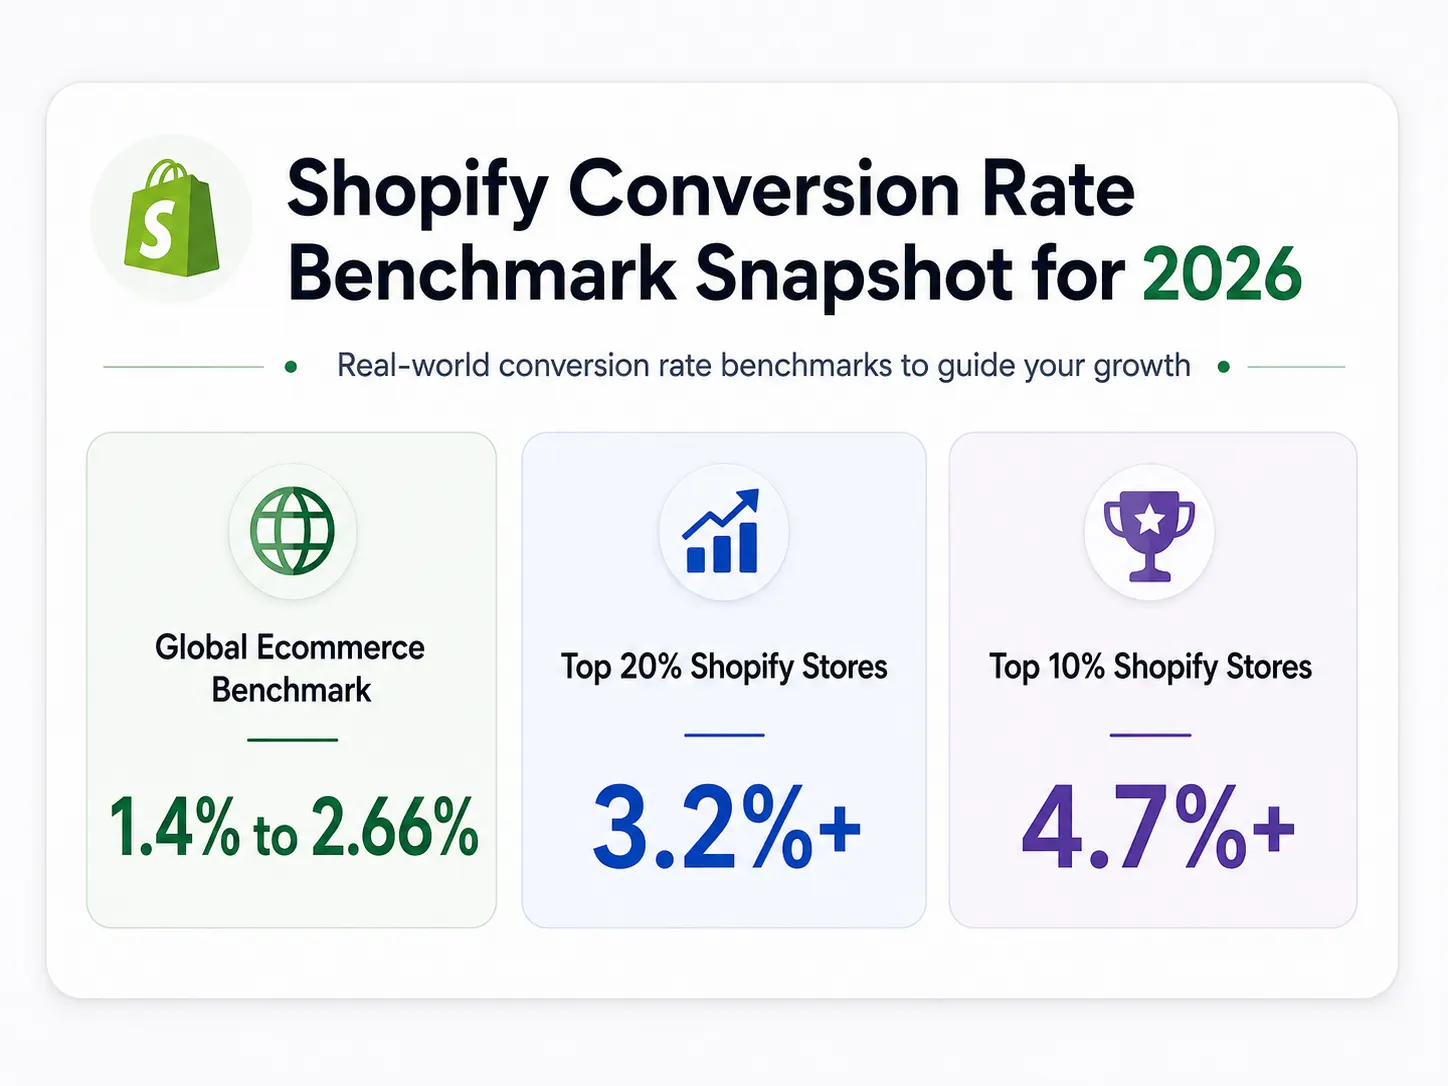
Shopify’s August 2026 ecommerce conversion guide cites a 1.4% global ecommerce purchase conversion rate for Q1 2026. The same guide cites Dynamic Yield, which reports a global average of about 2.66% across a benchmark dataset covering more than 400 brands.
Littledata’s Shopify-specific study found a 1.4% average across about 2,800 Shopify stores. In that dataset, stores above 3.2% were in the top 20%, while stores above 4.7% were in the top 10%. The study used 2023 data, so it is better used as Shopify-specific context than as a fixed 2026 target.
This is where benchmark articles often go wrong. A 1.4% figure from one dataset and a 2.66% figure from another are not two answers to the same question. Source, date, traffic mix, and store mix matter.
Shopify Conversion Rate Benchmarks by Industry
Shopify’s August 2026 guide reports the following industry conversion rates using June 2026 benchmark data.
The discrepancy is large for a reason.
A buyer purchasing pet food or skincare may have prior knowledge about that particular product. The order will likely be familiar, less risky, and easy to replicate.
A buyer purchasing a sofa, premium watch, or luxury product will likely compare multiple brands during the course of days and weeks.
It will reduce the session-based conversion rate despite being good for the business.
What Makes for a Good Shopify Conversion Rate by Industry?
Use the benchmark table as guidance and not a pass or fail grade.
Fashion brands converting 2.5% will be near their industry benchmark. Luxury brands doing 2.5% will be way above their stated industry benchmark.
Price of the product plays a factor here as well.
More expensive products will need further research, trust, and time before the buyer is ready to make the purchase.
Even with low conversion rates, the business can flourish as long as the Average Order Value, margins, and repeat customer metrics are sound.
This is the reason Shopify conversion rate needs to be analyzed with a holistic approach to DTC unit economics.
How Should Global Shopify Conversion Rates Be Compared?
A global average is only a starting point.
Markets differ in payment habits, delivery expectations, mobile usage, return behaviour, trust, and price sensitivity.
A blended global number can hide those differences.
For example, imagine an international Shopify brand with these rates:
- US: 3.1%
- UK: 2.7%
- Germany: 1.8%
- UAE: 1.4%
A blended rate might look healthy while one market is improving and another is losing customers.
If you sell across several countries, track each market separately and compare it with its own historical performance.
That gives you a much clearer benchmark than forcing every market to match one global target.
Mobile vs Desktop Shopify Conversion Rate
Mobile brings most ecommerce traffic, but desktop still converts better.
Contentsquare’s 2026 Digital Experience Benchmark covers about 99 billion web and app sessions across more than 6,000 sites. Mobile represented around 69.9% of traffic, while desktop conversion was 74% higher than mobile conversion. Its mobile benchmark reports desktop conversion at about 3.4%.
For Shopify stores, this gap matters.
A healthy blended rate can hide weak mobile performance.
If your mobile conversion rate is low, check:
- Page speed
- Product image loading
- Navigation and search
- Variant selection
- Size and fit information
- Add-to-cart usability
- Payment options
- Form length
- Checkout friction
Mobile should not be treated as a smaller version of your desktop store.
For many ecommerce brands, mobile is the main store experience.
New vs Returning Visitor Conversion Rates
Returning visitors often convert better because they already know the brand.
Contentsquare’s 2026 benchmark found a 2.9% conversion rate for returning visitors, compared with 1.7% for new visitors. Returning visitors also represented more than half of traffic in its dataset.
That matters for D2C brands.
Conversion rate optimisation is not only about page layouts and checkout design.
Email, SMS, WhatsApp, loyalty programmes, remarketing, and good post-purchase experiences can bring higher-intent customers back to your store.
In other words, CRO and retention should work together.
This is also why customer retention and acquisition should be evaluated as connected parts of ecommerce growth.
How Does Shopify Conversion Rate Vary by Traffic Source?
Traffic source can change conversion rate as much as site design.
A shopper searching Google for a specific product may be close to buying. Someone who sees a cold social ad may be discovering your brand for the first time.
Consider this example:
Channel | Sessions | Orders | Conversion Rate |
Email | 10,000 | 450 | 4.5% |
Paid Search | 20,000 | 560 | 2.8% |
Paid Social | 50,000 | 750 | 1.5% |
Email has the highest conversion rate in this example, but that does not mean paid social is failing.
Email traffic may include past customers and subscribers who already trust the brand.
Contentsquare’s 2026 data found paid search conversion at about 2.8%, making it one of the stronger paid channels in its benchmark. Compare channels based on intent and role, not just one blended conversion number.
This is also where accurate marketing attribution becomes important.
Your Storewide Conversion Rate Can Hide the Real Problem
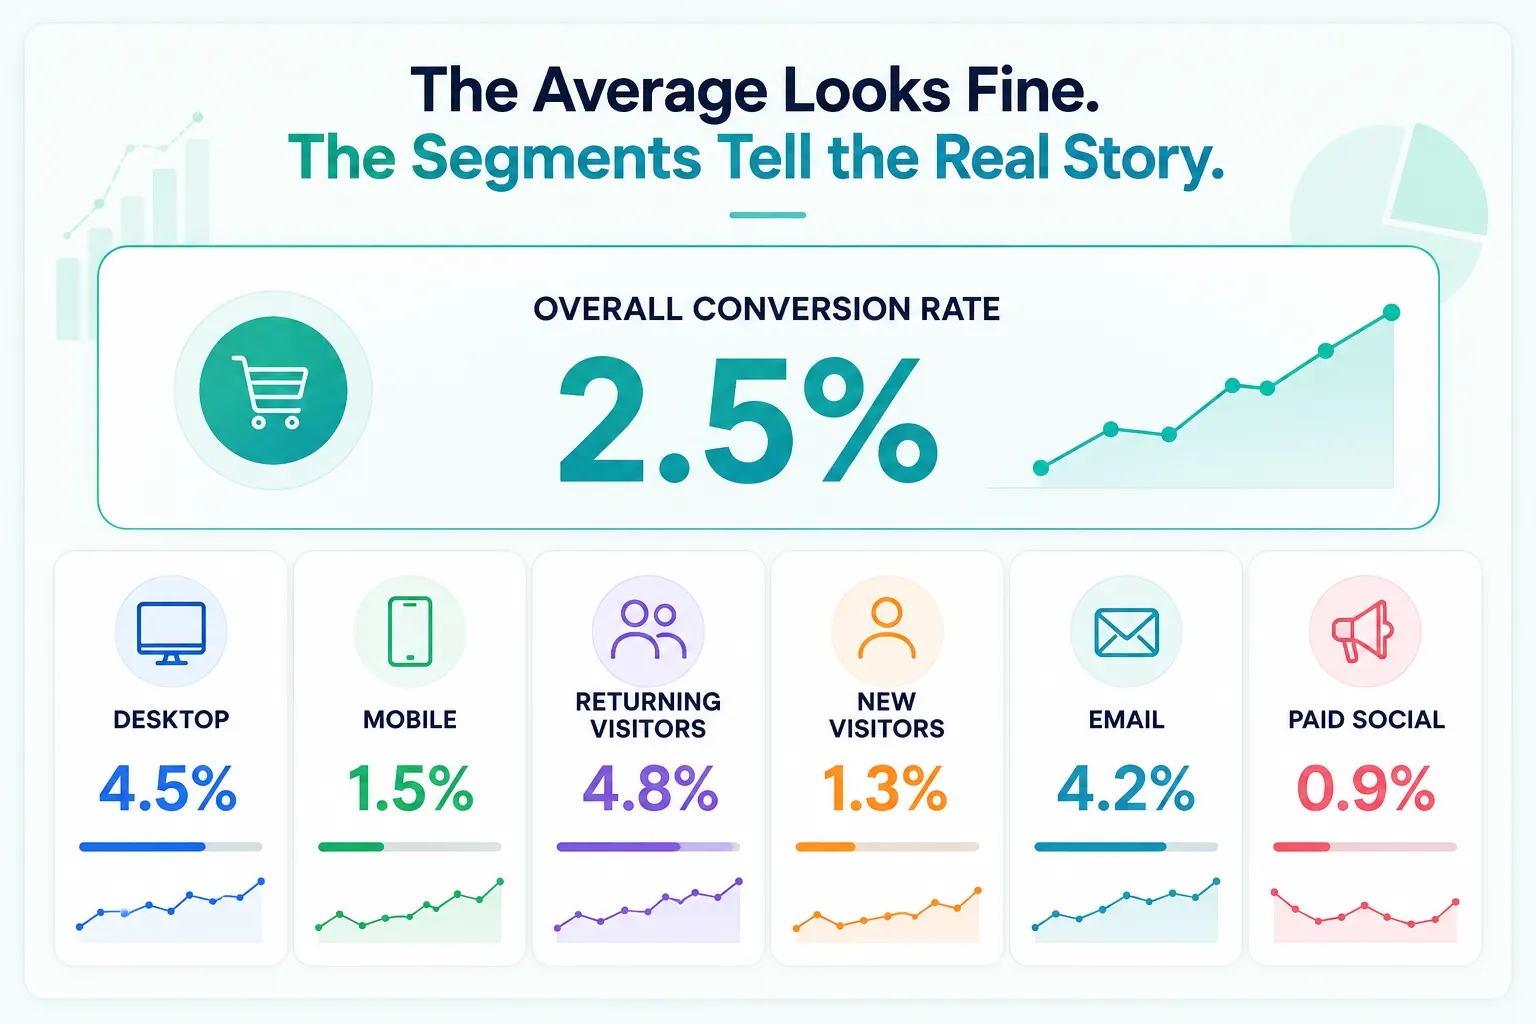
Suppose Shopify shows an overall conversion rate of 2.5%.
That sounds healthy.
But underneath the average, you could have:
- Desktop: 4.5%
- Mobile: 1.5%
Or:
- Returning visitors: 4.8%
- New visitors: 1.3%
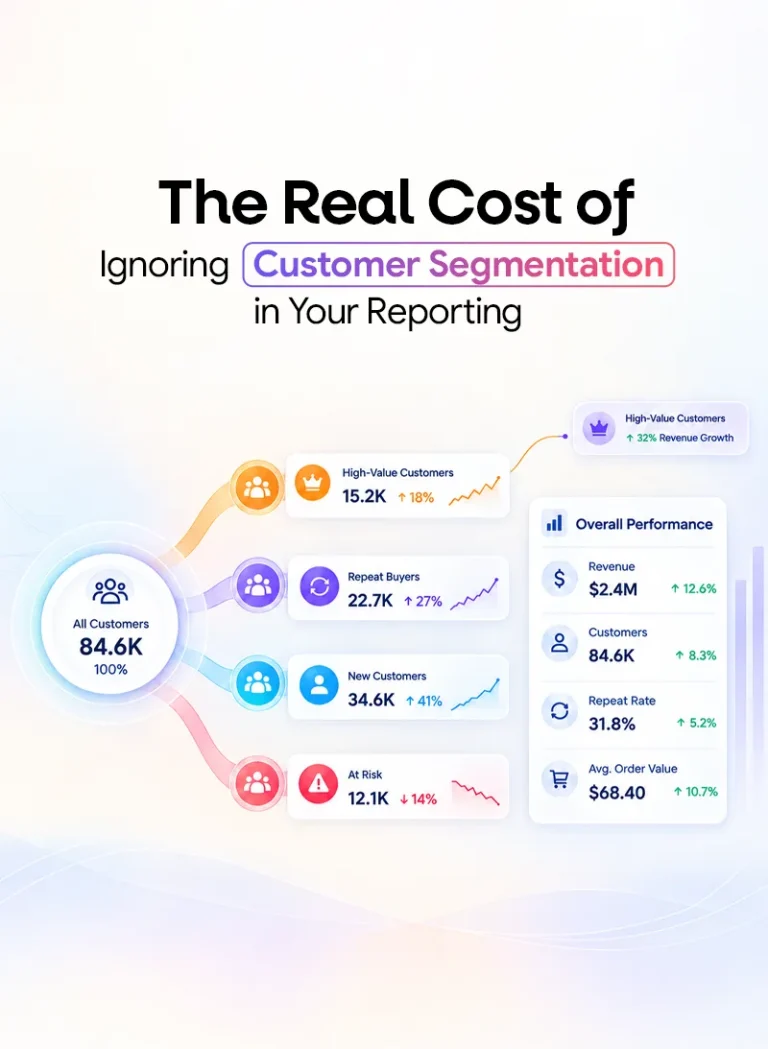
Averages are useful for reporting.
They are less useful when you need to decide what to fix.
Break Shopify conversion rate down by:
Device → Customer type → Traffic source → Product → Landing page → Campaign → Market
Conversion rate is one of the weekly ecommerce metrics founders should monitor, but the segments underneath it often tell the more useful story.
Which Shopify Conversion Funnel Metrics Should You Track?
The final purchase rate is only the end of the story.
Shopify now reports several funnel metrics that help explain what happens before the sale.
1. Added-to-Cart Rate
This shows the share of sessions where shoppers add an item to their cart.
If product views are strong but cart additions are weak, review the product page.
Look at pricing, images, reviews, product details, sizing, delivery information, and offer clarity.
2. Reached-Checkout Rate
This shows how many store sessions reach checkout.
If shoppers add products but do not move forward, review the cart experience, delivery costs, and offer terms.
3. Checkout Conversion Rate
Shopify defines checkout conversion rate as completed purchase sessions divided by sessions that reached checkout.
Baymard’s long-running ecommerce research puts average cart abandonment at about 70%. That makes checkout friction an important area to investigate when checkout starts are healthy but purchases are weak.
4. Product Conversion Rate
Shopify can also report how often a product is purchased relative to its product views.
This helps you find products that attract traffic but fail to convert, as well as products that may deserve more visibility.
Why Shopify and GA4 Conversion Rates May Not Match
Shopify and Google Analytics 4 may report different conversion numbers.
That does not always mean one platform is wrong.
The platforms can use different session rules, consent settings, attribution logic, and event tracking.
Google Analytics uses ecommerce events such as add_to_cart, begin_checkout, and purchase. Google also confirms that several Shopify ecommerce events can be collected through its Shopify integration.
Shopify also notes that bot traffic can affect conversion reporting and offers a human-traffic filter in Analytics.
Pick a clear source of truth for each KPI. Then compare trends using the same definition over time.
How to Benchmark Your Shopify Conversion Rate Correctly
Start broad, then narrow the comparison.
- Global benchmark: Understand the wider ecommerce range.
- Industry benchmark: Compare your store with similar categories.
- Device benchmark: Separate mobile and desktop.
- Customer benchmark: Compare new and returning visitors.
- Traffic-source benchmark: Compare paid, organic, email, direct, and referral traffic.
- Historical benchmark: Compare month over month, quarter over quarter, and year over year.
Your benchmark becomes more useful as it becomes more specific.
Your own store history is often more actionable than a global average.
How to Increase Shopify Conversion Rate
Do not start with colour changes to buttons based on CRO advice.
Focus first on areas where your funnel loses the most valuable customers.
1. Optimize Product Pages
With high traffic and low cart addition, make sure that the decision-making process is easy.
Provide convincing benefits, appealing images, reviews, valuable product details, shipping info, returns info, and prices.
Make sure that the customer does not need to find information himself.
2. Reduce Cart and Checkout Friction
With good traffic and cart additions but bad orders, focus further down the funnel.
Check shipping costs, payment methods, form filling process, promo codes, delivery info, and trust.
3. Make Mobile a Priority
If mobile generates most visits, even minor issues with mobile could impact a sizable portion of your sales.
Perform tests for your pages on actual smartphones. Assess performance, tap areas, images, forms, and payments.
4. Align Your Landing Page with Traffic Intent
While a stranger on Meta needs more convincing, a person looking up your company name via search does not.
The landing page you use should live up to the promise made in the ad or email or search snippet or campaign
5. Drive Repeat Visitors
Benchmark data indicates that repeat visitors have a higher conversion rate compared to first-time visitors.
Retention campaigns can be used to drive repeat visits through product viewing, adding items to carts, completing purchases, and important life cycle events.
6. Test Only One Hypothesis at a Time
It is a bad practice to change five things and speculate about what works.
Good CRO testing begins with:
A clear problem → A reason for the change → One main outcome to measure
Which Metrics Matter Alongside Shopify Conversion Rate?
A higher conversion rate does not always mean a healthier business.
Suppose conversion rises from 2% to 2.5%, but AOV falls, discounts increase, and CAC rises.
You may be creating more orders but less profit.
Read conversion rate alongside:
- Average Order Value
- Customer Acquisition Cost
- ROAS
- Customer Lifetime Value
- Repeat Purchase Rate
- Contribution Margin
- Revenue per Session
These metrics answer a more important question:
Are you converting traffic profitably?
From Shopify Conversion Data to Better Decisions
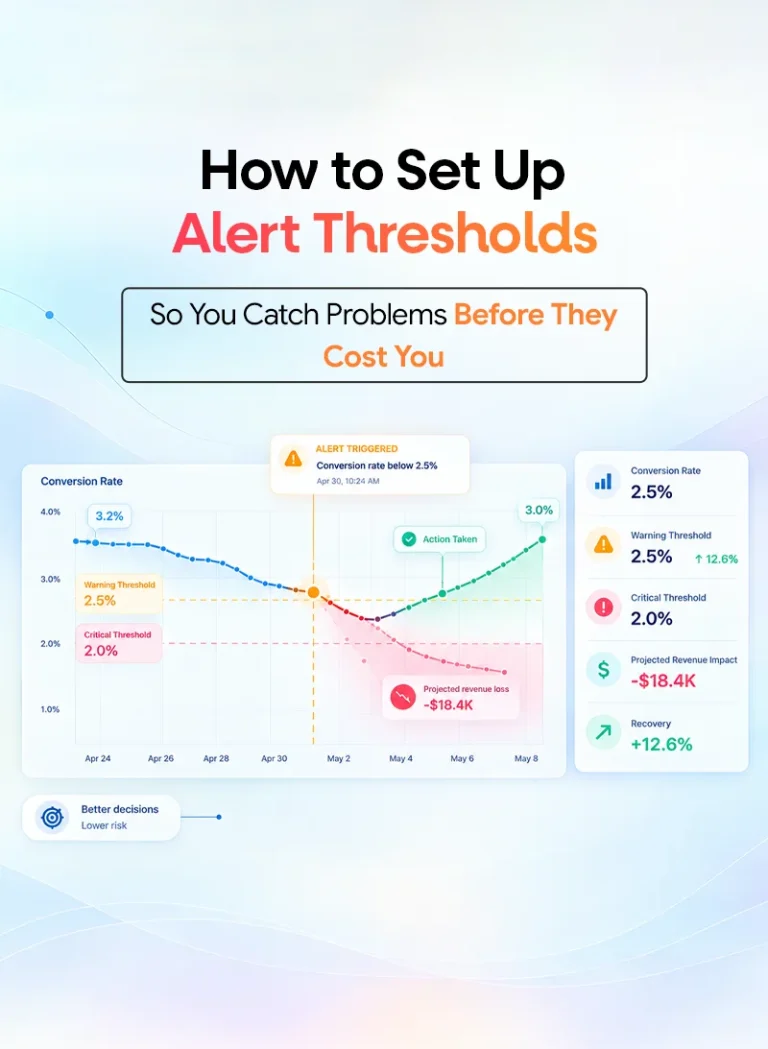
A dashboard may tell you that conversion fell from 2.8% to 2.3%.
That is useful, but it is not a diagnosis.
You still need to ask:
- Did mobile performance fall?
- Did traffic mix change?
- Did paid social scale?
- Did returning traffic drop?
- Did a key product stop converting?
- Did checkout completion change?
- Did AOV move at the same time?
This is where ecommerce decision intelligence becomes more useful than simply collecting more metrics.
NetSights brings ecommerce, marketing, and customer signals together so teams can understand changes in context.
iSight helps surface unusual movements across metrics such as revenue, ROAS, conversion rate, spend, and AOV.
A benchmark tells you where you stand.
The next step is understanding why.
What Shopify Conversion Rate Should Your Store Aim For?
Do not choose 3% just because it appears in a benchmark article.
Start with your current rate.
Then compare it with your:
- Industry
- Device mix
- Traffic sources
- Customer groups
- Markets
- Historical performance
If your store moves from 1.8% to 2.1% while AOV, CAC, and margin remain healthy, that can be a meaningful win.
The goal is not to achieve the highest possible conversion rate.
The goal is to turn more of the right traffic into profitable customers.
Conclusion: The Right Shopify Conversion Rate Is the One That Fits Your Business
Shopify conversion rate benchmarks are useful because they give you a point of reference. But they should never become a fixed target for every store.
A 2% conversion rate may be strong for one industry and weak for another. Product price, traffic source, device mix, customer type, market, and purchase intent can all change what good performance looks like.
Start with global and industry benchmarks to understand where your store stands. Then go deeper into your own data across mobile, desktop, traffic sources, products, and customer segments.
Your historical performance is often the most useful benchmark of all. If conversion is improving while AOV, CAC, margin, and retention remain healthy, your store is moving in the right direction.
The goal is not simply to chase a higher percentage. It is to convert more of the right visitors into profitable customers and use your data to understand what is driving that growth.
Turn Shopify Data Into Better Growth Decisions
Your Shopify, marketing, and customer data already contains the signals you need.
NetSights helps connect those signals so you can spot important changes, understand what is driving performance, and act faster.
FAQs