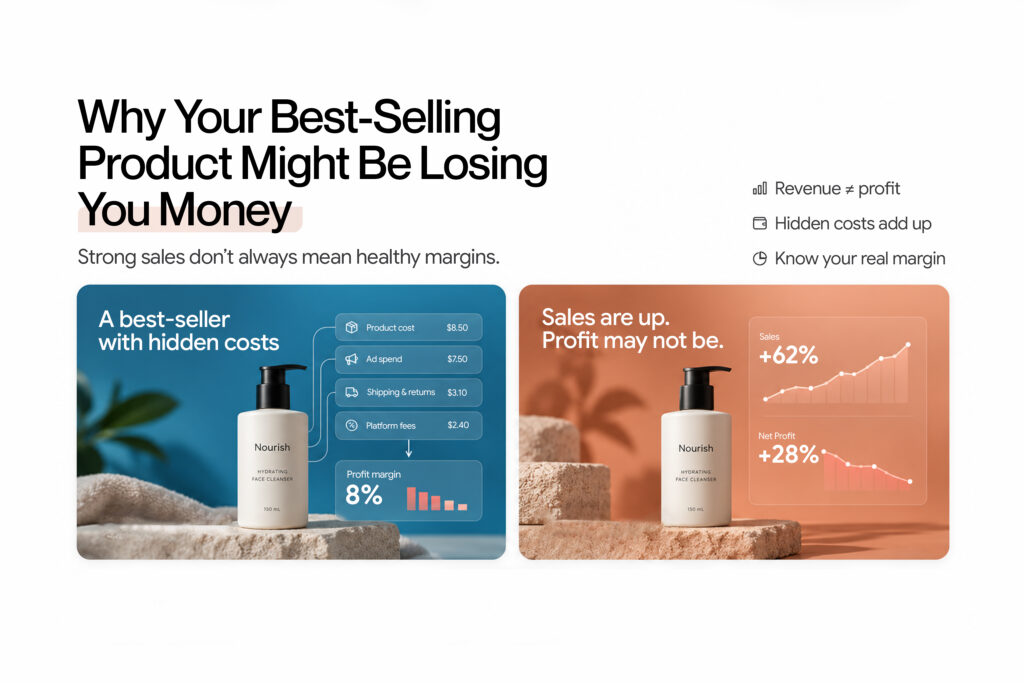
A product can be a best performer in your sales charts and still money is lost on each order. Product profitability shows what is left after deducting product costs, discounts, shipping, ads, and returns. Here’s how to analyze the gap between strong sales and healthy profit, and what to do about it.
Every Monday, Alisha (Sales Head) check her store’s sales performance before opening her emails.
For three weeks consequently, the same tote bag had topped the list. Customers loved its roomy design. Her team kept packing orders. The ads brought in sales, and the reviews looked good.
So she ordered more stock. By the end of the month, revenue had grown. Yet the balance in her business account barely moved.
“How are we selling more and keeping so little?” she asked. The answer was hiding inside the product everyone thought was winning.
Alisha’s story and all figures below are fictional. They illustrate how costs can affect a bestseller.
When More Sales Don’t Mean More Profit
Alisha sold the tote bag for ₹1,499. It costs her ₹600 to source. At first glance, she was saving ₹899 per bag. There seemed to be enough room for a discount, free shipping, and some ad spend.
But ₹899 was only the gap between the full selling price and the product cost. It was not the money her business kept. Most customers applied a website discount code to buy the products. Every order needed packaging and delivery. Payment processing fees took another share. Paid ads brought their own bill.
Then came the returns. This is where product profitability matters. It looks beyond sales volume to ask a better question: after the relevant costs, how much does this product earn?
A bestseller product tells you what people buy. It does not tell you what each sale contributes to your business.
The Product Cost Analysis That Changed the Story
Alisha sat down with her operations lead and reviewed the tote’s sale.
They used a simple model: one bag per order, free delivery, and prices excluding tax collected for the government.
Item | Amount per order |
Listed selling price | ₹1,499 |
Discount ( Coupon Code) | -₹150 |
Price after discount | ₹1,349 |
Cost of goods sold | -₹600 |
Packaging | -₹45 |
Fulfilment costs | -₹55 |
Shipping cost | -₹110 |
Payment Gateway processing fees | -₹35 |
Allocated acquisition spend | -₹350 |
Expected net cost of returns | -₹90 |
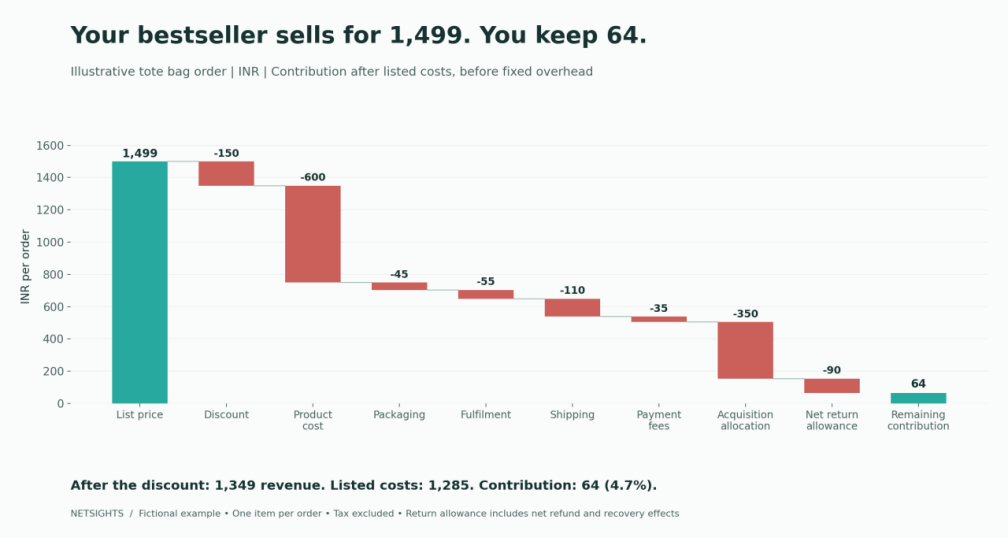
Contribution after these costs | ₹64 |
The ₹90 return allowance covered the average net impact of refunds, reverse shipping, handling, and stock recovery across orders. It was an estimate based on past results.
Figure 1: Only ₹64 remains after the listed costs, before fixed overhead.
That meant a contribution margin of roughly 4.7% on ₹1,349 of revenue. Salaries, software, and other fixed overhead still needed to be covered.
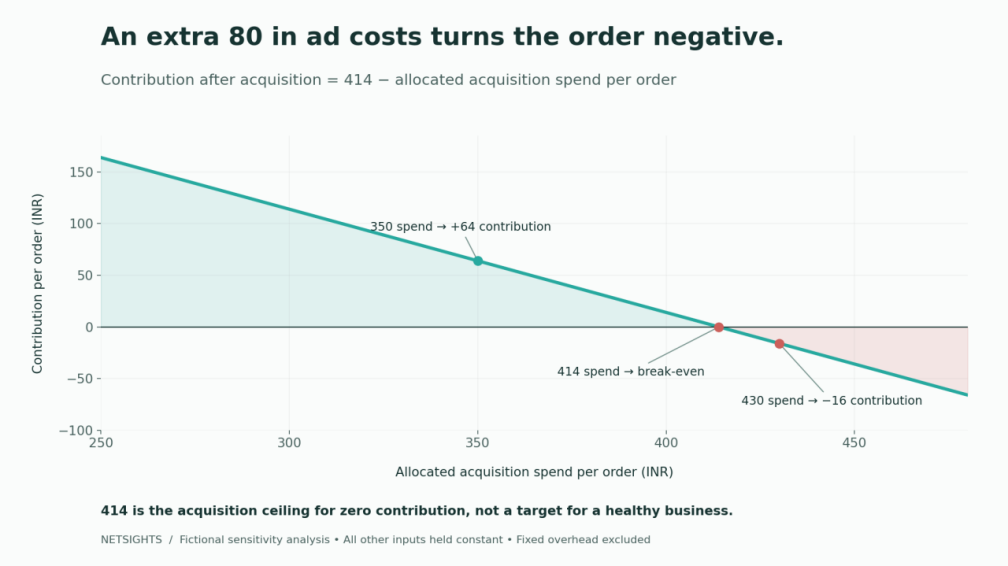
If allocated acquisition spend rose from ₹350 to ₹430, the same order would lose ₹16 before those fixed costs.
Figure 2: With other inputs unchanged, contribution reaches zero at ₹414 of allocated acquisition spend. That leaves nothing for fixed overhead.
Gross Margin and Contribution Margin Tell Different Stories
Alisha had not ignored her numbers. She had been looking at an incomplete picture.
Gross Margin Is the Starting Point
Gross profit is net sales minus cost of goods sold. Gross margin expresses that amount as a percentage of net sales.
In this example:
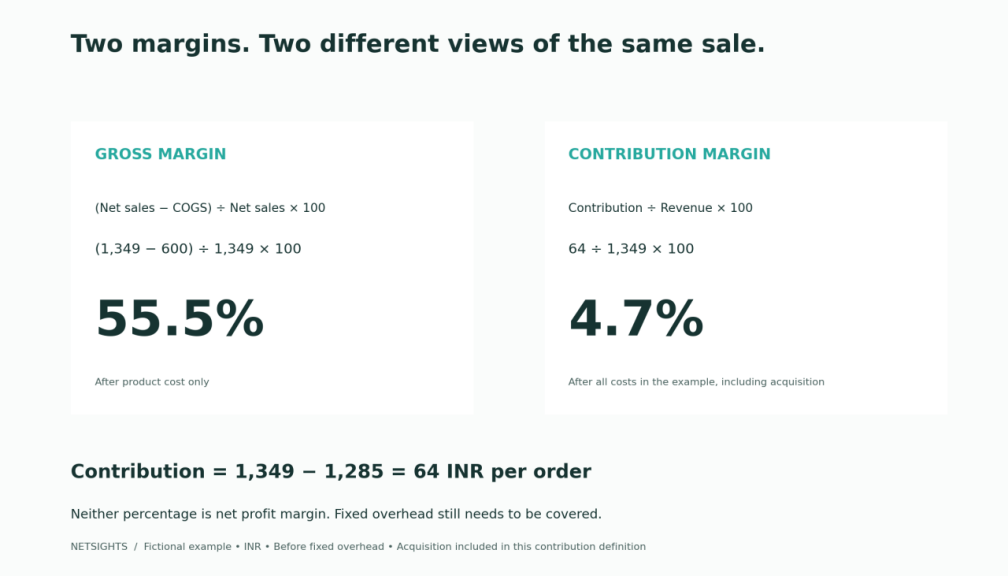
Gross margin = (₹1,349 – ₹600) ÷ ₹1,349 × 100 = 55.5%
That figure looked healthy. But it did not include all the costs listed in the table.
Shopify’s guide to profit reports explains how recorded product costs, discounts, and refunds affect reported gross profit. Keeping those records accurate is essential.
Contribution Margin Shows What Is Left to Cover Overhead
A product’s contribution margin is the money left from sales revenue after subtracting variable costs. The remaining amount helps cover fixed costs before generating profit, as explained in Shopify’s break-even analysis guide.
For this analysis, Alisha included allocated acquisition spend to see the tote’s contribution after advertising.
Contribution = ₹1,349 – ₹1,285 = ₹64
Contribution margin = ₹64 ÷ ₹1,349 × 100 = 4.7%
Businesses may report contributions at different stages, such as before and after marketing. Labeling each stage clearly for comparisons is very useful.
Figure 3: Gross margin and contribution margin include different costs. Neither figure is net profit margin.
The Hidden Ecommerce Costs Behind a Bestseller
While none of the individual costs surprised Alisha, she was shocked by their combined total.
Discounts Become Part of the Real Selling Price
A short promotion can become a habit, ideally 3-7 days
When most customers purchase products using promotional codes, the listed price no longer serves as an accurate indicator of revenue. Consequently, your product margin analysis must be based on the actual amounts paid by customers. This is what intelligent companies analyze in their review meetings.
A small discount can take a large share of the money left after costs.
Shipping and Return Costs Can Change the Result
A heavy product ( like a wooden sofa) may cost more to deliver. Fragile items(Glass items, TV, show pieces) need an extra layer of packaging, like, bubble wrap, thermocol support. Some pin-codes may be more expensive to serve due to distance or remote approach. Returns add another layer of loss to the revenue. A refund can reverse revenue while leaving delivery and handling costs behind.
Use a consistent method: either work on net sales after actual refunds or add an expected return allowance. Avoid counting the same loss twice.
For a wider review, read our guide to seven hidden profit leaks hurting ecommerce margins.
Advertising Costs Can Rise While Sales Stay Strong
While Google and Meta Ads still generate conversions, they often become increasingly expensive over time.
Customer acquisition cost (CAC) measures cost incurred in acquiring a new customer. It is not automatically the advertising cost of every unit sold.
For product-level profitability, use a clear allocation method. Treat that allocation as an estimate, especially when one order contains several products.
Our article on profitable revenue versus ROAS explains why strong ad returns can still leave weak margins.
Inventory Uses Cash Before It Earns Anything
Alisha’s larger stock order created another problem: a large amount of cash got blocked in maintaining the stock.
Inventory carrying costs can include storage, financing, damage, and markdowns. Some belong in a broader stock review rather than a simple per-order calculation.
Either way, they affect the value of a product to the business.
How to Run a Useful Product Profitability Analysis
Alisha did not need a perfect model to start. She needed a consistent one.
Start With Your Main Products
Top selling products should be reviewed first, along with products on which heavy ad spend or frequent returns is happening. For each SKU, we should record net sales, units sold, product cost, fulfilment cost, shipping, fees, returns, and allocated marketing spend.
SKU-level profitability is crucial because broad product averages often obscure performance variations across different sizes, colors, or pack configurations. Evaluating individual SKUs provides a precise financial picture.
Compare Products Over the Same Period
While analysing the sales and costs data, compare matching dates. Allow time for returns to appear, particularly after a busy promotion. Keep your cost per product current. Supplier prices and courier charges can change while a spreadsheet stays untouched.
When costs are missing, flag the gap. An empty cell should not make a product look more profitable.
Read Profit Alongside Other Product Performance Metrics
A useful best-selling product analysis includes contribution per unit, total contribution, return rates, discounts, average order value, and repeat purchases.Margin percentage alone is not enough. A lower-margin item may generate more total contribution through steady sales.
Netsights Scaleboard brings SKU performance, acquisition, inventory, and fulfilment signals into one board. Those signals can help teams decide where to investigate next.The aim is to understand ecommerce unit economics without losing sight of the whole business.
What to Do With High-Selling, Low-Profit Products
Alisha did not remove the tote from her store, customers wanted it. She needed to improve what each sale earned.
First, she did A/B testing with a smaller discount. Then she reviewed packaging and spoke to her fulfilment partner about costs.
She also tested a bundle with a useful accessory. That raised the average order value, but she checked the extra product and delivery costs before calling it a success.
At last, she adjusted ad budgets using contribution after marketing alongside sales results.
Some products may earn little on the first order but bring customers back. That can be worthwhile, provided repeat purchase data supports it. Our guide to CAC versus LTV for D2C profitability looks at that relationship in more detail.
Future profit should be measured, not assumed.
Give Your Bestseller a Better Job
The next month, Alisha continued her sales analysis on Mondays.But she added another question: “What did these orders leave behind?”
Before increasing your bestseller’s budget, review its full cost picture. Compare your five biggest sellers after fulfilment, returns, and marketing.
For help spotting changes in acquisition costs and contribution margin signals, see how iSight supports daily performance analysis.
Your most profitable products may not be the ones at the top of the sales chart.
FAQs