
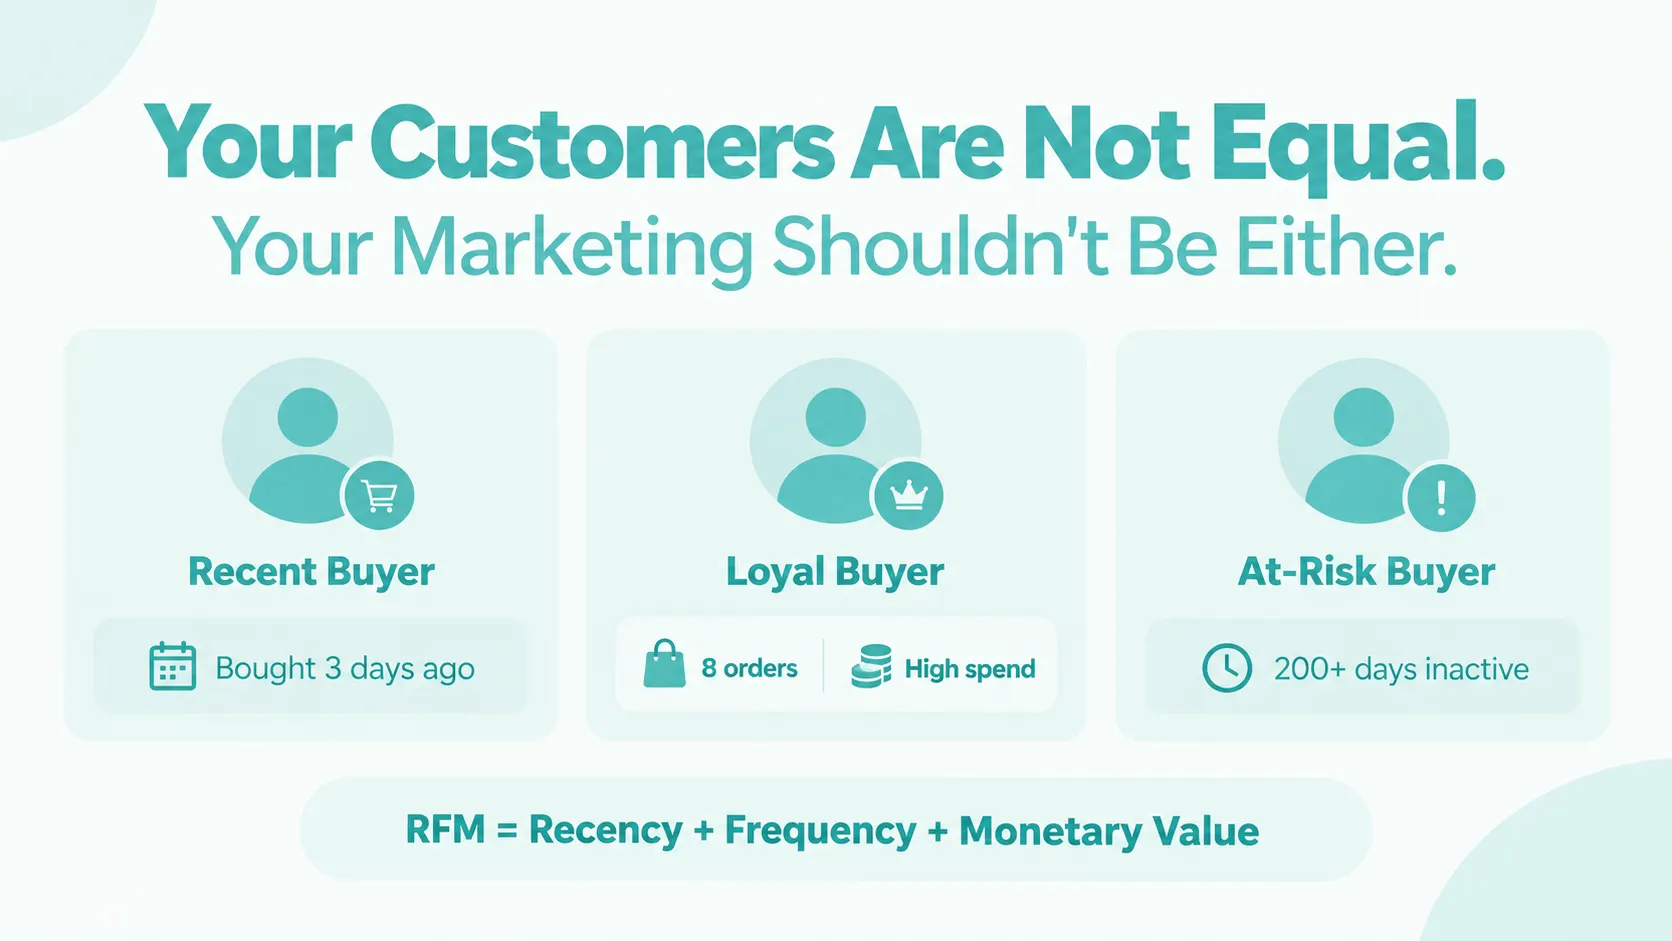
Each of the two customers has spent £900 on purchases at your store.
One ordered goods five days ago. This is his eighth purchase.
The other ordered a significant amount of goods nine months ago and hasn’t visited your store since then.
If we look only at the income, these customers seem to have equal value. However, this is far from being true.
This is precisely what the RFM analysis is all about.
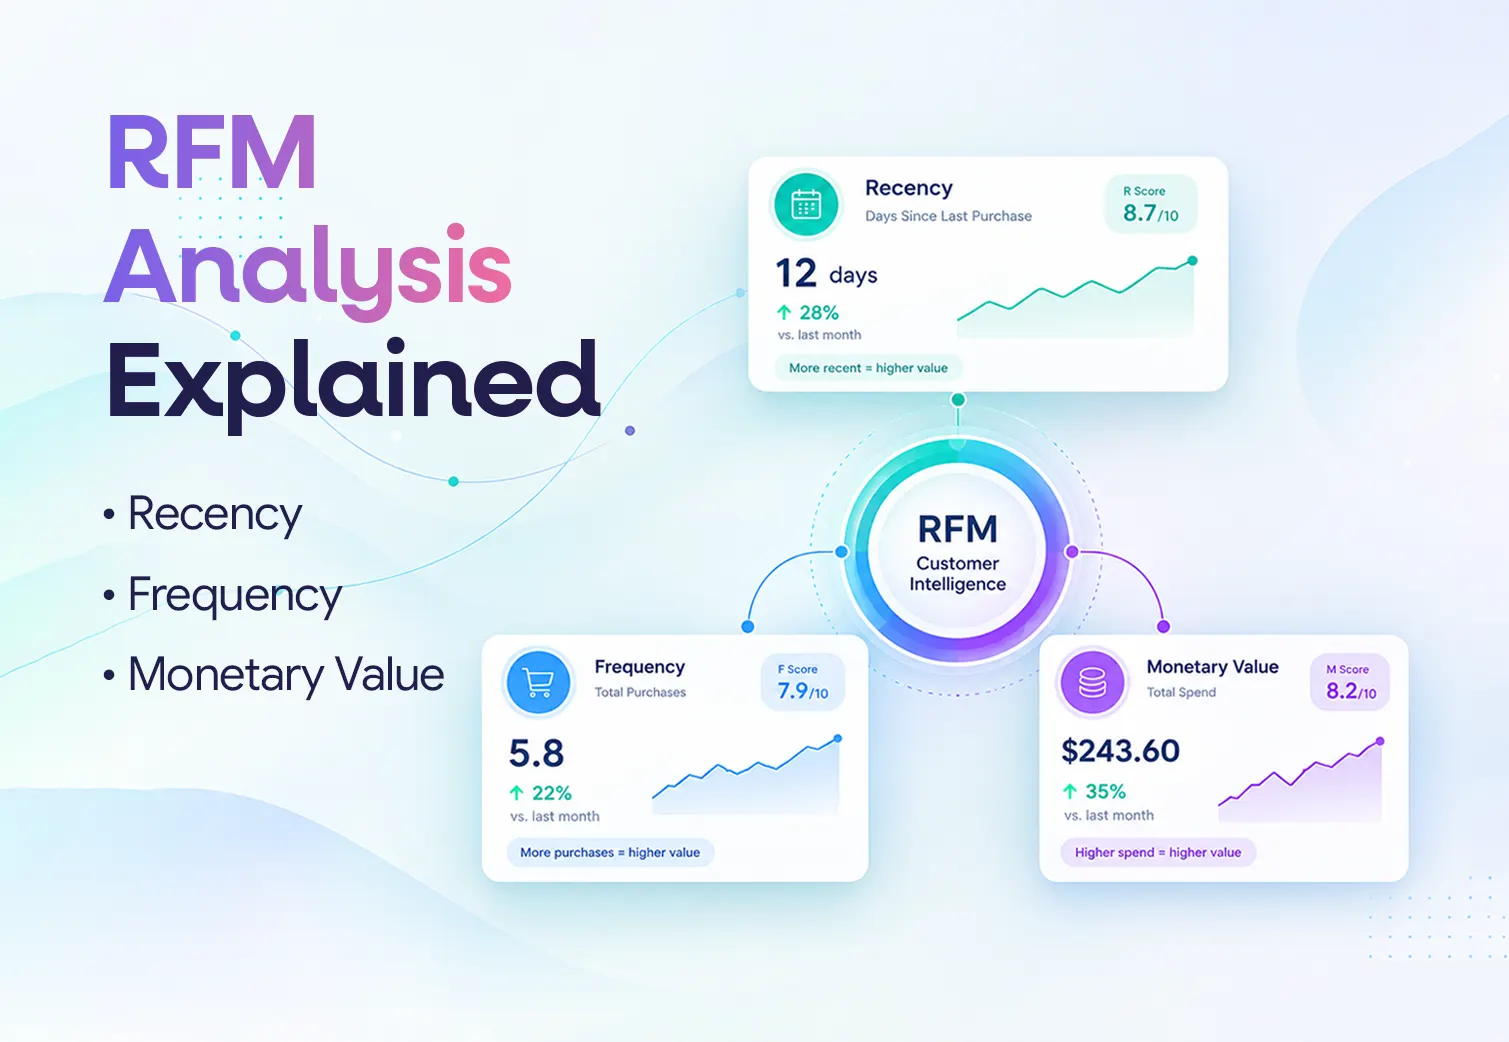
Recency, Frequency, Monetary value – RFM for short. This metric takes into account when the customer bought something, how frequently he or she does that and how much money this customer spends in your store. These three signs help eCommerce managers differentiate loyal clients from new ones, valuable shoppers from those at risk and potential ones.
More importantly, RFM makes sense of customer data.
Turn customer behaviour into smarter retention decisions.
RFM analysis is a behavioral segmentation tool that segments customers based on recency, frequency, and monetary value.
The elements are:
Imagine RFM as a framework for adding depth to customer revenues.
Let’s say Customer A and Customer B have both spent £500.
Customer A made five purchases within six months.
Customer B made one £500 purchase 18 months ago.
Their historic spend is the same but their relationship with the brand isn’t.
Customer A is exhibiting behaviors of recent and repeated purchase while Customer B is inactive.
That is the essence of RFM analysis.
RFM is popular because it uses existing information in every ecommerce business to produce actionable customer segments. Academic literature also applies RFM analysis to ecommerce customer segmentation and value models.
Most ecommerce businesses do not have a shortage of customer data.
They have a shortage of context.
Shopify tells you who ordered. Klaviyo tells you who opened an email. Meta and Google show acquisition performance. Your CRM stores customer records.
But a founder or retention team still needs to answer:
Which customers need our attention today?
A standard customer database does not tell you that.
Neither does total revenue.
A customer who ordered yesterday should not automatically receive the same offer as a once-loyal customer who disappeared six months ago.
RFM gives you a way to separate those situations.
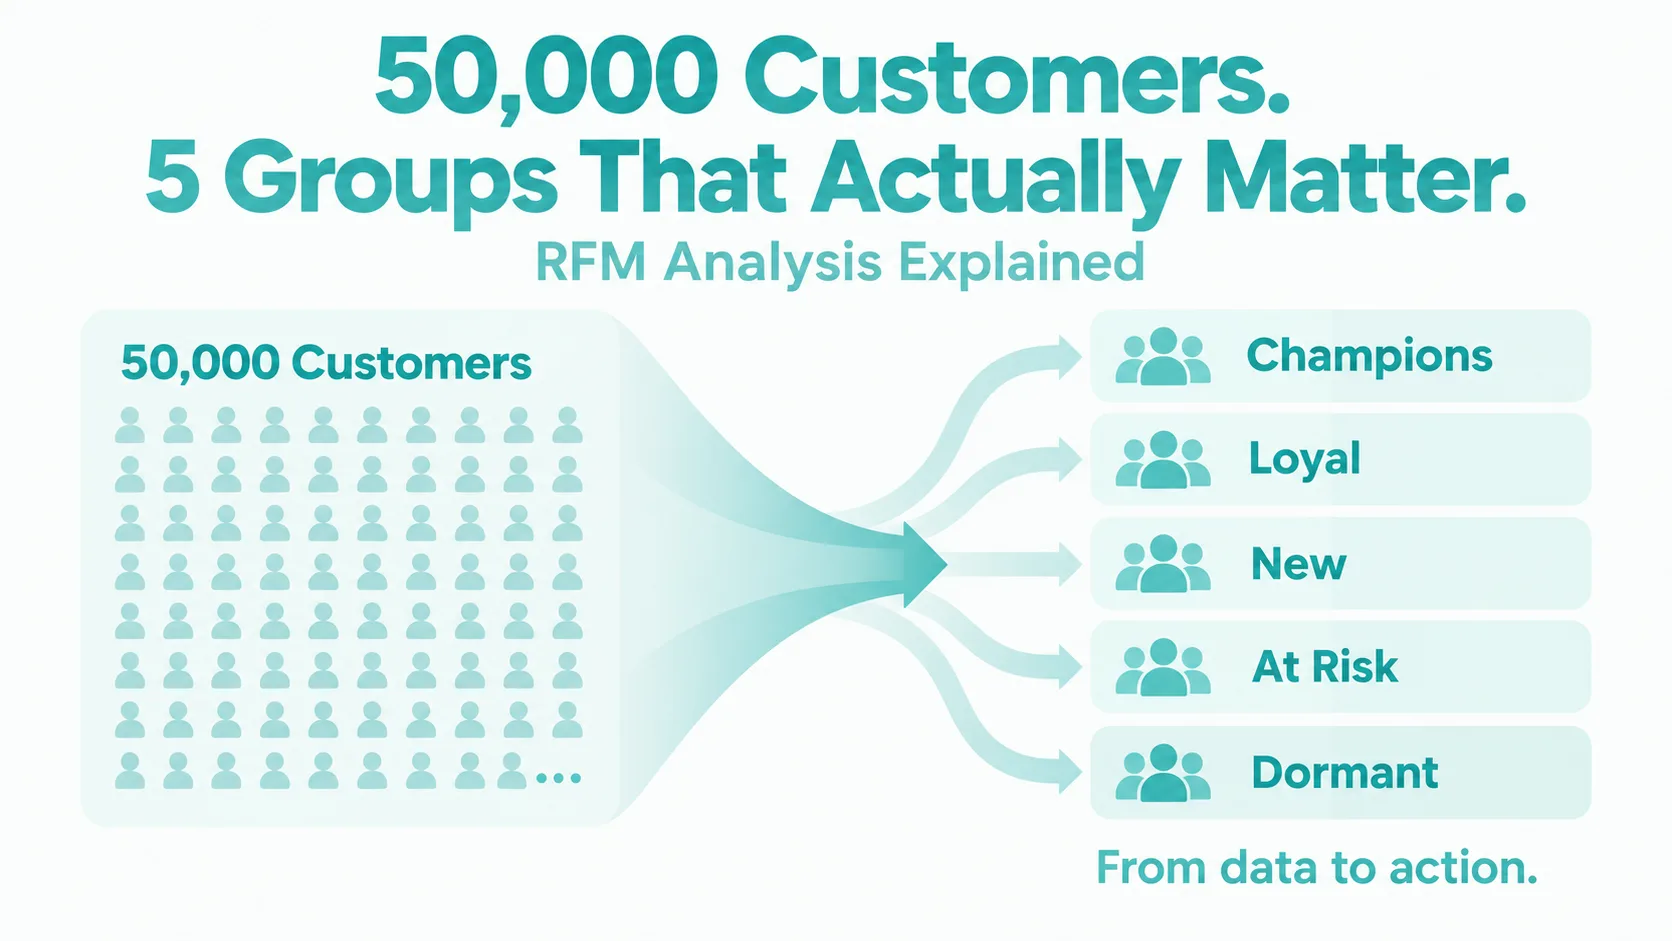
Instead of seeing 50,000 customers in one list, you begin seeing groups such as:
That makes RFM customer segmentation particularly useful for retention marketing.
Each element of the RFM model gives you a different signal.
Recency measures how long it has been since the customer’s latest purchase.
If one customer bought seven days ago and another bought 300 days ago, the first customer will usually receive a stronger recency score.
Why?
Because recent behaviour often tells you more about current buying intent than old behaviour.
But recency should never use an arbitrary threshold.
A coffee brand may consider a customer inactive after 60 days.
A furniture brand would probably not.
A skincare brand selling a 30-day product may begin worrying when a customer has not reordered after 60 or 90 days. A luxury jewellery store may expect much longer gaps.
The right recency window should reflect your normal purchase cycle.
Frequency measures how often a customer purchases.
One order proves the customer converted.
Eight orders tell you something more valuable: they keep choosing your brand.
High purchase frequency can help identify:
Again, context matters.
Buying coffee twelve times per year could be normal.
Buying twelve sofas would not.
Frequency should therefore be interpreted relative to your category and customer base.
RFM scoring turns raw customer behaviour into comparable values.
One common model assigns each customer a score from 1 to 5 for each RFM factor.
|
Score |
General Interpretation |
|
5 |
Among the strongest customers |
|
4 |
Above average |
|
3 |
Middle range |
|
2 |
Below average |
|
1 |
Among the weakest customers |
For Frequency and Monetary Value, higher raw values usually receive higher scores.
Recency works differently.
A lower number of days since the last order is better, so a customer who purchased three days ago could receive R5, while one who last purchased 400 days ago could receive R1.
The scores are then combined.
A customer may therefore have a score such as:
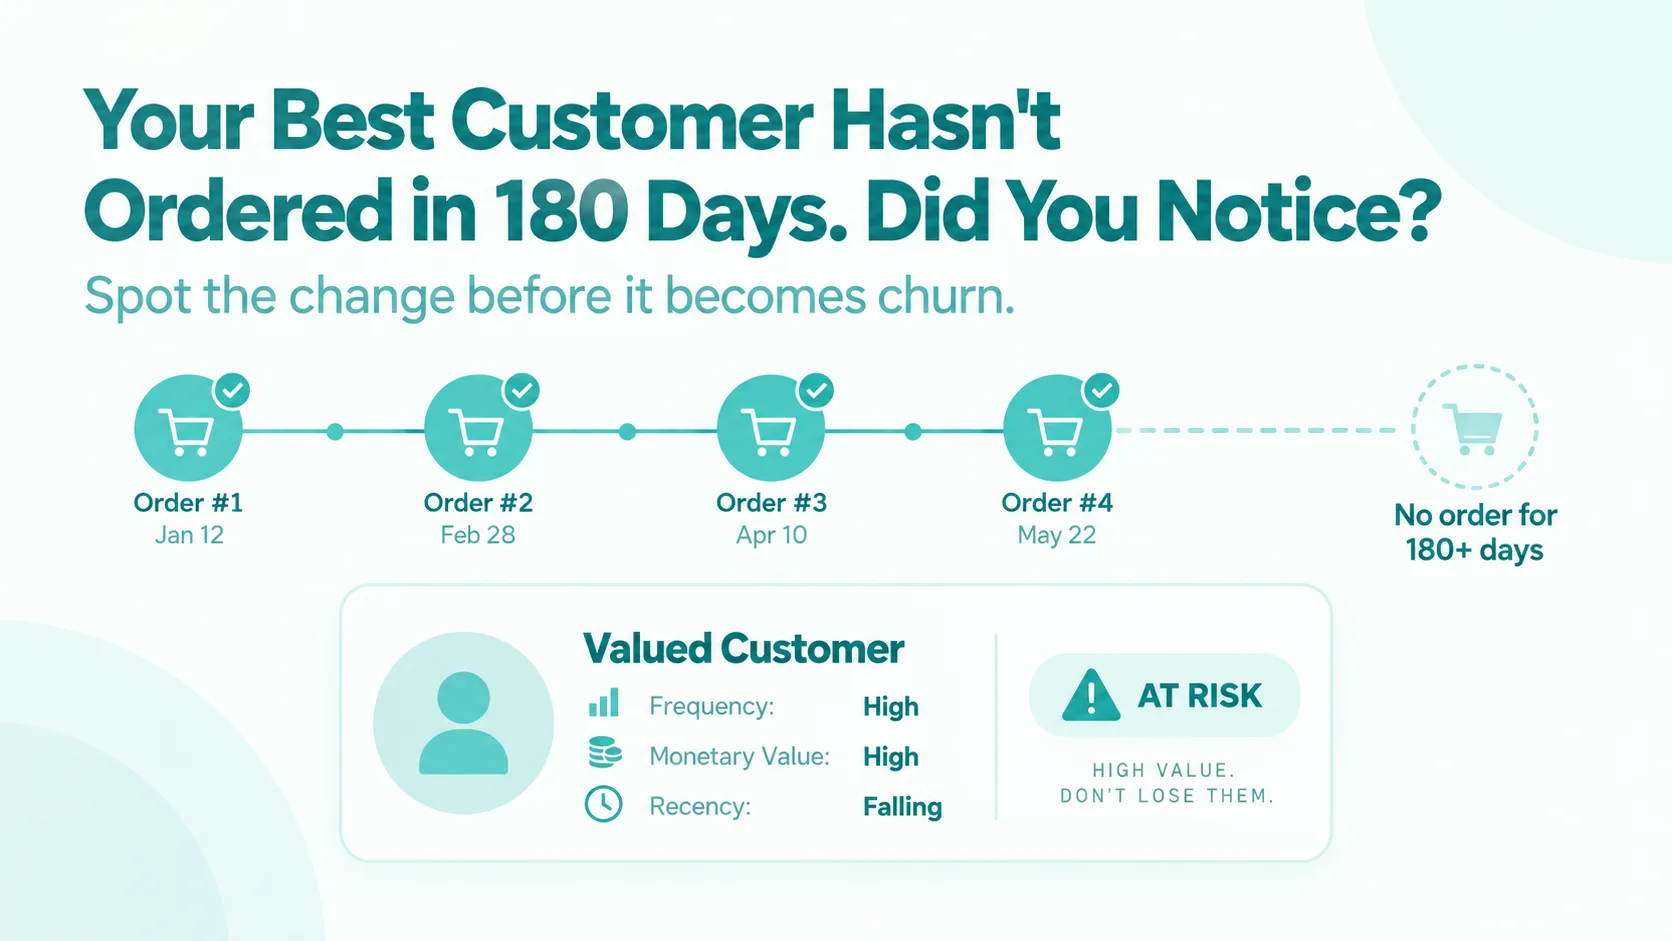
That last customer can be especially valuable.
They may not simply be “inactive.” They may be a previously valuable customer who is now at risk.
A basic process looks like this:
The calculation itself is not the difficult part.
Choosing meaningful thresholds is.
There are two common approaches.
You set specific rules.
For example:
This is easy to understand but can become outdated as the business grows.
Customers are ranked against other customers in the same database.
Shopify currently uses this approach in its native RFM customer analysis. Each R, F, and M dimension receives a score from 1 to 5 based on store data. A score of 5 represents roughly the top 20% for that dimension in the merchant’s customer base. Shopify then uses those scores to classify customers into RFM groups.
Klaviyo uses another approach. Its RFM model assigns scores from 1 to 3 and allows account-specific thresholds or percentile-based definitions.
That difference is worth remembering:
There is no universal RFM score that every business should copy.
Consider a D2C store with these five customers:
|
Customer |
Last Order |
Orders |
Total Spend |
Illustrative Score |
Likely Segment |
|
Priya |
5 days ago |
11 |
£1,450 |
555 |
Champion |
|
Alex |
12 days ago |
2 |
£175 |
412 |
Promising |
|
Maya |
38 days ago |
7 |
£780 |
444 |
Loyal |
|
Sam |
215 days ago |
9 |
£1,180 |
155 |
At Risk |
|
Daniel |
390 days ago |
1 |
£65 |
111 |
Dormant |
These scores are illustrative. Actual scores depend on the store’s customer distribution and scoring rules.
Now the data becomes useful.
Priya does not necessarily need another 15% discount.
She already buys often and spends heavily.
A better strategy might be early product access, a referral programme, loyalty rewards, or premium customer service.
Alex has purchased recently but only twice.
The goal is to build the buying habit.
Product education, complementary recommendations, replenishment reminders, or a second-order incentive may work better than a VIP campaign.
Sam is probably the most interesting person on the list.
He historically bought frequently and spent heavily but has not purchased for seven months.
A generic newsletter may not be enough.
A personalised campaign based on his previous products may be worth testing.
That is why a good RFM analysis example should not stop at the score.
The score is useful only when it changes what you do.
A practical RFM marketing strategy connects customer behaviour with the next action.
|
Segment |
Behaviour |
Main Goal |
Possible Action |
|
Champions |
Recent, frequent, high spend |
Retain |
VIP perks, referrals, early access |
|
Loyal |
Consistent repeat buyers |
Strengthen |
Loyalty, bundles, subscriptions |
|
New |
Very recent first purchase |
Drive second order |
Onboarding, education |
|
Promising |
Recent with early repeat signals |
Build habit |
Recommendations, follow-up |
|
High-value, low-frequency |
Large spend, fewer orders |
Increase frequency |
Premium cross-sell |
|
Needs Attention |
Previous engagement is weakening |
Re-engage |
Personalised reminder |
|
At Risk |
Valuable history, weak recency |
Win back |
Targeted comeback campaign |
|
Previously Loyal |
Strong past relationship |
Recover |
Personal outreach |
|
Almost Lost |
Long inactivity |
Test recovery |
Strong but selective incentive |
|
Dormant |
Old, low activity |
Limit spend |
Low-cost reactivation |
This is where behavioural segmentation can become more useful than treating demographics as the main signal.
Knowing that someone is 35 and lives in Manchester may help targeting.
Knowing that they purchased nine times, spent £1,200, and have suddenly stopped buying tells you something much closer to the business problem.
Different RFM groups need different strategies.
Acquiring the first order is only the beginning.
A new customer may benefit from:
The objective is to turn a transaction into a relationship.
A customer who already buys regularly does not always need another coupon.
You could test:
Retention is not the same as discounting.
Prioritise At-Risk Customers
Consider two inactive buyers:
Customer A made one £50 order nine months ago.
Customer B made ten orders worth £1,300 but has also been inactive for nine months.
Both are technically inactive.
They should not automatically receive the same treatment.
RFM helps you allocate more attention to the relationship that previously showed greater value.
Retention has a cost too.
Old customers can remain in paid audiences, email lists, SMS campaigns, and discount programmes for months without meaningful results.
RFM can help teams decide when continued reactivation effort is no longer justified.
RFM analysis for Shopify has become more useful because Shopify now includes native RFM customer analysis in its customer reports.
Shopify assigns each customer a three-digit RFM score and categorises customers into 11 groups, including:
Shopify calculates these groups using the customer’s Recency score and a combined view of Frequency and Monetary Value. Merchants can also use the rfm_group attribute when creating customer segments.
This creates practical questions for Shopify brands:
These questions are much more useful than simply asking how many customers purchased last month.
RFM becomes more valuable when the segment can trigger action.
Klaviyo connects RFM groups with customer marketing use cases such as retention, re-engagement, and personalised campaigns. Its scoring can also be customised based on a brand’s own customer behaviour.
Mailchimp supports purchase-based segmentation using information such as order behaviour and customer activity. This can help ecommerce businesses separate recent, repeat, high-value, and lapsed customers.
Adobe Commerce goes beyond basic purchase history by allowing dynamic customer segments based on attributes including customer information, order history, products, and shopping-cart behaviour.
The lesson is simple:
An RFM segment sitting in a spreadsheet does not improve retention.
A segment connected to your CRM, email platform, SMS tool, paid audience, or loyalty workflow can.
RFM is useful, but it does not replace every customer analytics method.
|
Method |
Main Question |
Best Used For |
|
RFM Analysis |
How is this customer behaving now? |
Segmentation and targeting |
|
Customer Lifetime Value |
How valuable is the relationship? |
Acquisition and retention economics |
|
Cohort Analysis |
How does a group behave over time? |
Retention trends |
|
Demographic Segmentation |
Who is the customer? |
Audience positioning |
|
Predictive Segmentation |
What might they do next? |
Forecasting and proactive targeting |
The strongest ecommerce analysis combines these perspectives.
A customer can have a strong RFM score but weak profitability because of returns.
Another customer may have average RFM scores but strongly predicted LTV.
RFM tells one part of the customer story.
RFM is simple enough to use quickly. That also makes it easy to misuse.
A high monetary score does not tell you whether the customer is profitable.
Review margin, discounts, refunds, and fulfilment costs too.
A 90-day gap can signal churn for supplements and perfectly normal behaviour for jewellery.
Use your own purchase cycle.
A customer who purchases every Christmas could look inactive in July even though their behaviour has not changed.
Two Champions may buy completely different categories, arrive through different channels, and have different margins.
RFM simplifies behaviour. It does not describe the entire customer.
Knowing that you have 5,000 Loyal customers is useful.
Knowing whether customers are moving from New → Active → Loyal → Champion is much more useful.
If New customers keep growing while Loyal customers shrink, acquisition may look healthy while retention deteriorates.
You do not need a complex data-science project to begin.
|
Step |
Action |
Question |
|
1 |
Clean order data |
Which transactions should count? |
|
2 |
Choose your time period |
How far back should we analyse? |
|
3 |
Calculate R, F, and M |
When, how often, how much? |
|
4 |
Select scoring rules |
Fixed thresholds or percentiles? |
|
5 |
Build segments |
Which behaviours need different actions? |
|
6 |
Activate campaigns |
What should each group receive? |
|
7 |
Measure segment movement |
Are customer relationships improving? |
|
8 |
Add LTV, CAC, margin, and product data |
Which groups are actually profitable? |
Step eight is where basic RFM starts becoming true customer intelligence.
Suppose the number of Champions in your store falls this month.
RFM tells you what happened.
It does not automatically tell you why.
You may still need to ask:
Those questions require a wider view of the business.
Netsights is built around that decision layer. Its Scaleboard brings marketing, product, customer, store, payment, and operational signals together and is designed to move from data to diagnosis and recommended action.
With iSight AI, teams can ask questions about connected ecommerce data in natural language rather than moving between separate reports.
So instead of stopping at:
“Our At-Risk segment grew.”
A team can investigate:
“What changed around the customers who became At Risk?”
That is the difference between customer segmentation and broader ecommerce decision intelligence.
And when an important metric changes, Netifications can surface performance alerts and summaries through channels such as WhatsApp, Slack, and email.
Connect customer segments with the metrics that explain what changed.
RFM analysis answers three straightforward questions:
Those answers can help ecommerce teams stop treating every customer as if they have the same relationship with the brand.
But the score is only the beginning.
Track who moves from New to Loyal. Watch which Champions become At Risk. Compare those changes with repeat purchase rate, LTV, CAC, margin, products, channels, and operational performance.
Because RFM can tell you which customers changed.
The bigger business question is why they changed and what you should do next.
See what your customer data is really telling you.
A: RFM analysis is a customer segmentation model based on Recency, Frequency, and Monetary Value. It helps businesses group customers according to when they last purchased, how often they purchase, and how much they spend.
A: RFM stands for Recency, Frequency, and Monetary Value. Recency measures time since the last purchase. Frequency measures how often someone buys. Monetary Value measures customer spend.
A: Calculate each customer’s last purchase date, number of purchases, and total spend. Rank customers for each metric and assign scores. Many models use scores from 1 to 5, although platforms and businesses can use different scoring systems.
A: There is no universal good RFM score. In a 1-to-5 model, 555 normally represents a customer who ranks highly for recency, frequency, and spend. The exact meaning depends on the scoring rules used by the business or platform.
A: RFM analysis can help businesses identify loyal customers, VIPs, promising new buyers, at-risk customers, and dormant customers. These groups can support retention campaigns, loyalty programmes, personalised CRM messaging, and win-back strategies.
A: Yes. Shopify now provides native RFM customer analysis and predefined customer groups that merchants can use for reporting and customer segmentation.
We write about growth, retention, and the numbers that actually predict what happens next for D2C brands. Have a topic you'd like us to cover? Get in touch .
Your ecommerce store already contains the answers. Learn how AI ecommerce analytics helps founders ask business questions, understand what changed and why, and move from scattered data to clearer decisions.
Your ecommerce store already contains the answers. Learn how AI ecommerce analytics helps founders ask business questions, understand what changed and why, and move from scattered data to clearer decisions.
Your ecommerce store already contains the answers. Learn how AI ecommerce analytics helps founders ask business questions, understand what changed and why, and move from scattered data to clearer decisions.