
A festive campaign can scale revenue quickly.
It can also scale bad data quickly.
A purchase event fires twice.
Meta takes credit for an order Google Ads also reports.
A bestseller looks profitable until it runs out of stock.
Gross revenue climbs, but refunds, COD failures and RTO rise with it.
Under normal trading conditions, a data problem may sit unnoticed for a few days.
During Diwali, those few days can mean wasted ad spend, missed revenue or a decision made from the wrong number.
The scale of the opportunity makes that risk more important. During the first 11 days of India’s 2025 festive ecommerce sales, Redseer estimated more than ₹60,000 crore in GMV, around 3.5 times normal business-as-usual levels.
That is why ecommerce data analytics should be part of festive-season planning before budgets rise.
The objective is not:
“Do we have dashboards?”
It is:
“Can we trust the data well enough to make a decision quickly?”
That distinction matters.
A traditional dashboard can show that revenue changed. A stronger ecommerce decision intelligence setup should help the team understand what changed around it, where to investigate and what action deserves attention.
Before the festive rush begins, here are ten areas every D2C brand should audit.
A useful ecommerce data audit starts before you open GA4 or Shopify.
Agree on three things.
Which platform owns each number?
For example:
|
Metric |
Primary Source |
|
Orders |
Shopify |
|
Store revenue |
Shopify / finance definition |
|
Website behaviour |
GA4 |
|
Meta attributed conversions |
Meta Ads |
|
Google attributed conversions |
Google Ads |
|
Inventory |
Shopify / ERP |
|
RTO |
Logistics platform |
|
Payment success |
Payment gateway |
The aim is not to make every platform report the same number.
It is to understand which system answers which question.
What does normal performance look like?
Yesterday is not always the right comparison.
Festive weekends may behave differently from weekdays. Mobile conversion may differ from desktop. A sale day should not automatically be compared with an ordinary Tuesday.
Who investigates when something looks wrong?
Marketing may own CAC.
Ecommerce may have its own conversion.
Operations may own inventory.
CX may own return spikes.
A technically correct report with no owner still does not create action.
This is where many teams begin drowning in ecommerce data instead of making decisions.
With those rules in place, begin the audit.
Do not start your ecommerce tracking audit by asking whether GA4 is installed.
Start by placing an order.
Test the complete journey:
Product View → Add to Cart → Checkout → Payment → Purchase
Then test the less convenient journeys:
Google’s GA4 documentation states that ecommerce events need to be implemented with the relevant parameters before Analytics can measure product interactions correctly. Purchase events can include transaction ID, value, currency, coupon and item-level details.
A purchase event can fire and still be wrong.
Check:
Unique transaction IDs are particularly important because GA4 uses them to deduplicate repeated purchase events.
Investigate when:
The purpose of the audit is not perfect tracking.
It is knowing where your measurement is reliable enough to support decisions.
Revenue is one of the simplest ecommerce metrics to display.
It is also one of the easiest to misunderstand.
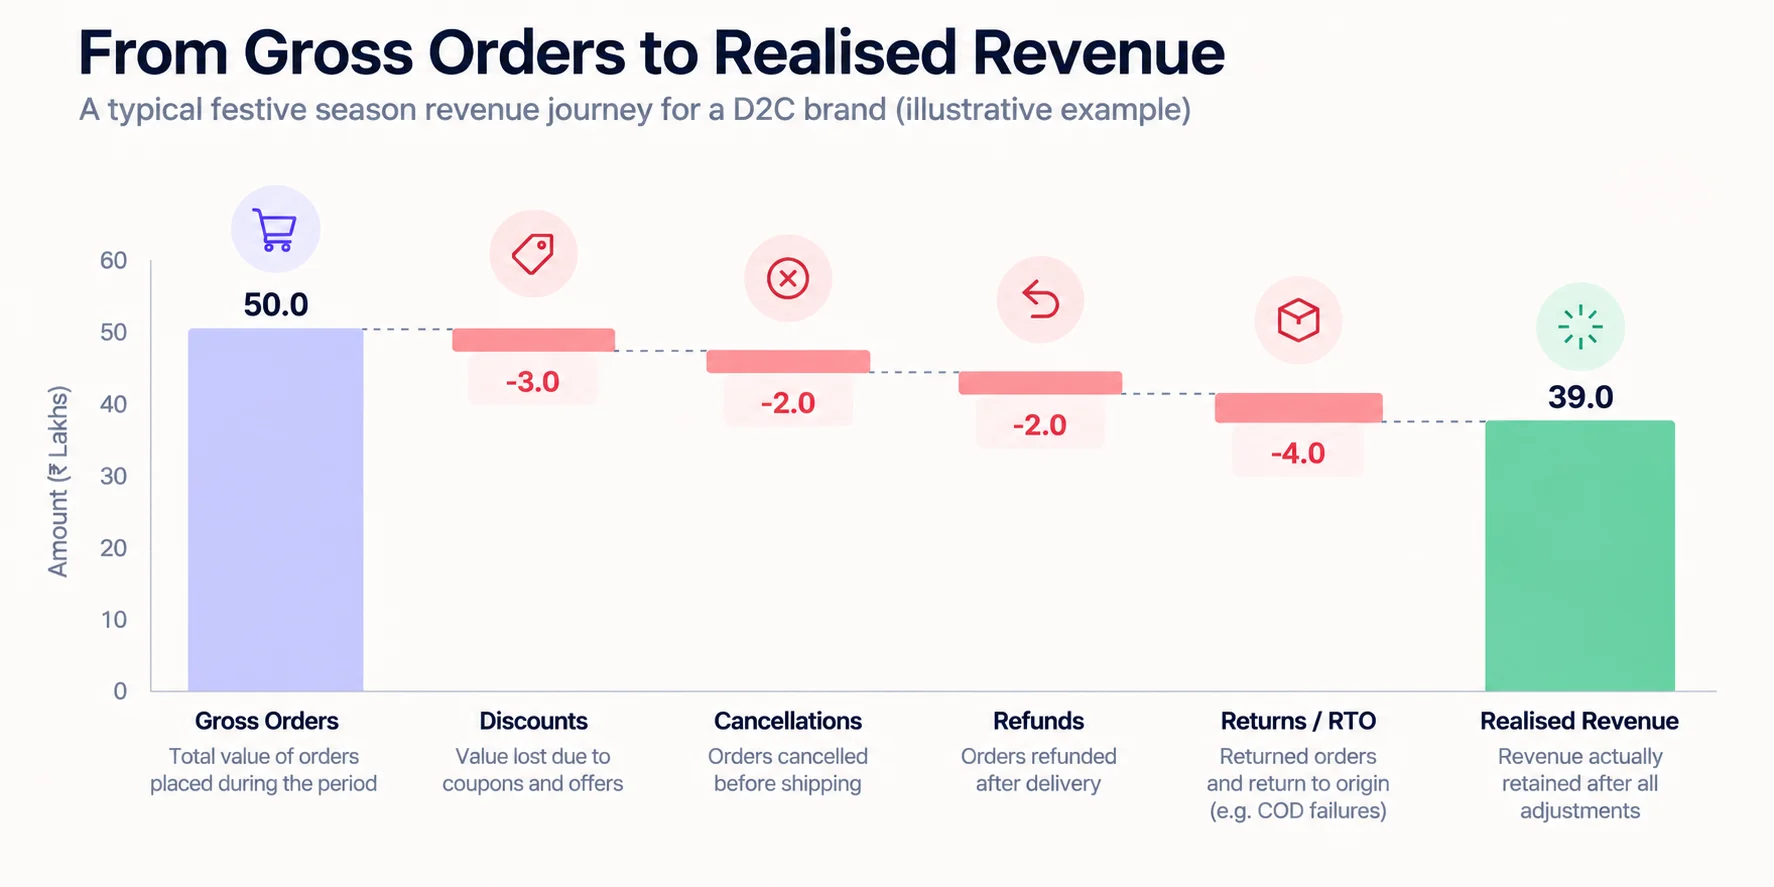
Imagine a festive campaign generates:
Placed order value: ₹50 lakh
Then:
The original ₹50 lakh still describes demand.
It does not describe the same commercial outcome as the revenue eventually retained.
Revenue is one of the simplest ecommerce metrics to display.
It is also one of the easiest to misunderstand.
Imagine a festive campaign generates:
Placed order value: ₹50 lakh
Then:
The original ₹50 lakh still describes demand.
It does not describe the same commercial outcome as the revenue eventually retained.
A stronger ecommerce data management process separates:
Gross order value
↓
Discounts
↓
Cancellations
↓
Refunds
↓
Returns
↓
RTO
↓
Realised revenue
This distinction becomes especially important for brands with a large COD share.
It also explains why DTC unit economics should sit beside top-line revenue and why hidden ecommerce profit leaks can make growth look healthier than it really is.
Revenue yesterday: ₹50 lakh.
Placed order value reached ₹50 lakh. After current cancellations and refunds, retained order value stands at ₹44 lakh. COD orders represent 38% of remaining value, with final RTO still to mature.
The second view gives the team more context.
That is what festive reporting should do.
One of the most common festive-season reporting debates is:
“Why doesn’t Meta revenue match Shopify?”
It usually should not match exactly.
Shopify records store transactions.
Meta and Google Ads apply attribution logic to advertising interactions.
GA4 provides another view of acquisition and onsite behaviour.
These systems serve different purposes.
The important question is:
Can you explain the difference?
Suppose yesterday shows:
|
Platform |
Reported Revenue |
|
Shopify |
₹10,00,000 |
|
GA4 |
₹9,40,000 |
|
Meta Ads |
₹5,80,000 |
|
Google Ads |
₹3,60,000 |
Do not add Meta and Google together and conclude that paid media generated ₹9.4 lakh.
A customer may interact with both before purchasing.
Instead, monitor how these relationships change over time.
If Meta normally reports 50–60% of store revenue and suddenly reports 90%, investigate.
If Google Ads conversions collapse while store orders remain stable, check tracking before cutting spend.
The Netsights guide to marketing attribution explains why platform numbers can disagree without one platform automatically being wrong.
Once the measurement layer is stable, use a broader ROAS optimisation checklist before making budget changes.
A normal month may have 20 campaigns.
The festive period can turn that into hundreds of campaign, creative, influencer and CRM links.
Poor naming creates poor analysis.
You may see:
all referring to similar activities.
Humans understand the connection.
Reporting tools treat them as separate values.
For example:
Then define the same logic for:
A campaign name might look like:
DIWALI26 | META | PROSPECTING | SAREE | VIDEO01
Anyone opening the report should understand what it means.
The same discipline should apply to email and retention campaigns. Engagement metrics such as D2C email open rate become more useful when campaign naming and downstream revenue tracking follow the same structure.
Naming documents do not enforce themselves.
Before campaigns go live, someone should confirm that UTMs and naming conventions follow the agreed structure.
Otherwise, the
Imagine a Meta campaign reaching 5x ROAS.
The immediate reaction is:
Scale it.
Now add one piece of information:
The product has three days of stock remaining and replenishment takes nine days.
The decision changes.
This is why ecommerce data analytics should not keep marketing and inventory in separate worlds.
Consider:
Product A:
100 units left
5 units sold per day
Product B:
100 units left
40 units sold per day
Both show the same stock quantity.
Only one is close to a stockout.
A more useful measure is:
Days of Inventory Remaining = Current Inventory ÷ Average Units Sold Per Day
Shopify’s inventory reporting uses the same underlying approach for its days-of-inventory-remaining metric.
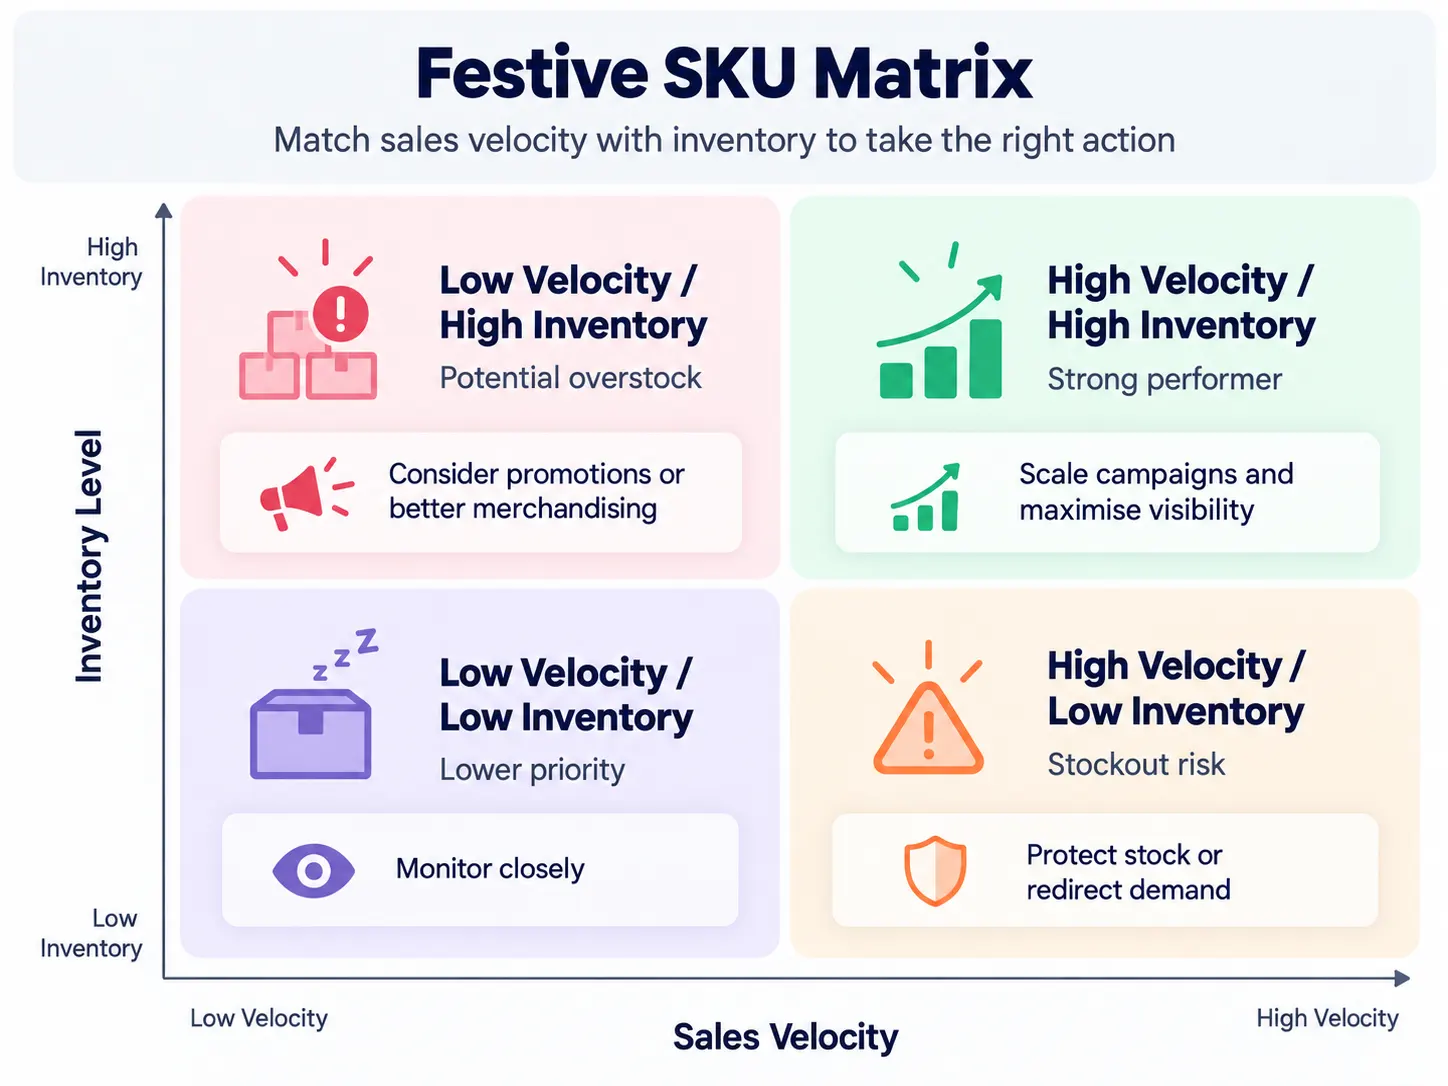
|
Sales Velocity |
Inventory |
Likely Action |
|
High |
High |
Potential scaling opportunity |
|
High |
Low |
Protect stock / redirect demand |
|
Low |
High |
Promotion or merchandising opportunity |
|
Low |
Low |
Lower priority |
Do not interpret this as an automatic rule.
Margin, replenishment time, product importance and expected demand still matter.
Research into ecommerce demand forecasting also supports the wider principle that using richer data sources can improve demand forecasting compared with narrower inputs in the environment studied.
For fast-growing brands, product decisions should also connect with a wider data-driven growth strategy and the operating discipline required when scaling ecommerce from $1M to $10M.
Festive campaigns often generate a wave of first-time buyers.
That is useful.
But acquisition volume alone does not tell you whether those customers are valuable.
Suppose:
Audience A
Audience B
Audience A looks better if the team watches CAC alone.
The picture can change when customer value is included.
This is why CAC versus LTV matters more than acquisition cost in isolation.
You should also understand the customer acquisition cost payback period and use CAC benchmarks by industry as context rather than a universal target.
At minimum:
Then compare:
Festive strategy should also decide how much growth should come from new customers versus the existing base. The economics of customer retention versus acquisition can help frame that decision.
More traffic does not guarantee more revenue.
Suppose sessions rise 60%.
Orders rise 15%.
Something changed between arrival and purchase.
Your next question should be:
Where?
Break the funnel into stages:
Session → Product View → Add to Cart → Checkout → Payment → Purchase
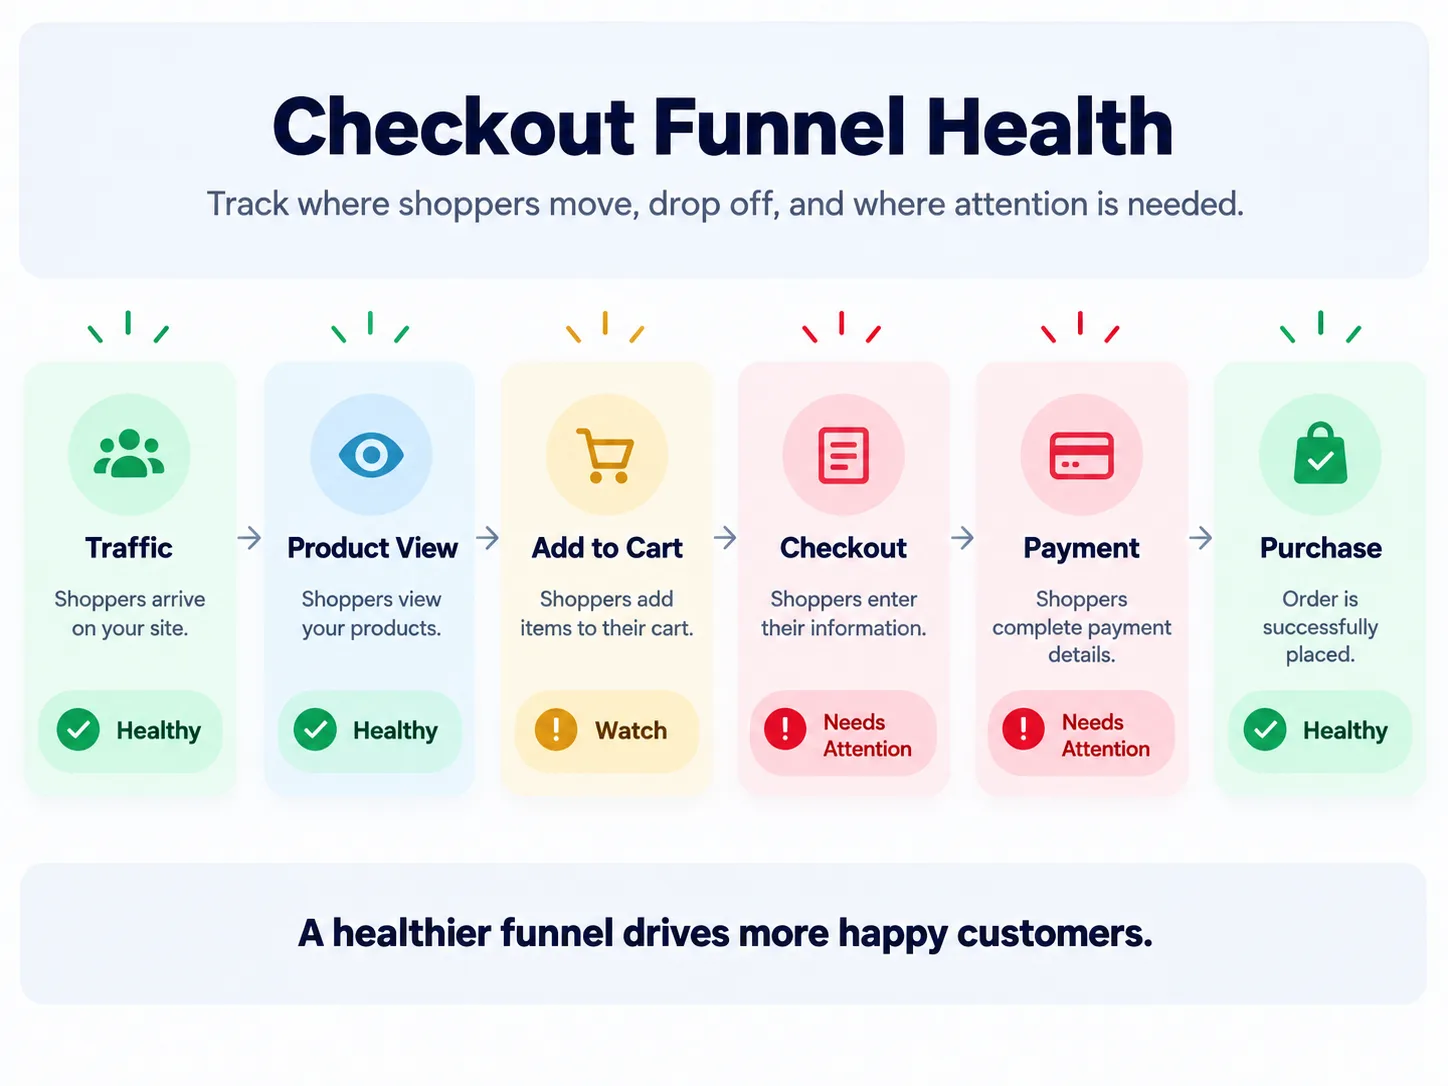
Investigate traffic quality, product pricing, messaging and offer relevance.
Investigate cart UX, shipping charges, delivery expectations and promotional errors.
Investigate payment performance, checkout errors and site issues.
Investigate cancellations, refunds, returns and RTO.
This is more useful than saying:
“Conversion rate is down.”
The Netsights guide to ecommerce conversion rate provides a deeper framework for diagnosing the number rather than simply reporting it.
Do not rely only on store-wide conversion.
Look at:
A 10% overall decline could hide a much larger mobile checkout issue.
Consider this result:
Strong campaign?
Maybe.
Now add:
The original platform ROAS has not changed.
The business outcome has.
That is why your festive season sales strategy needs two views.
This prevents advertising performance from being separated from what happens after checkout.
It also helps identify profit leaks that hurt ecommerce businesses even when topline sales are rising.
Do not stop at:
RTO = 18%.
Break it down by:
A high RTO rate concentrated in one geography needs a different response from a store-wide increase.
That is where data becomes useful for operations, not just marketing.
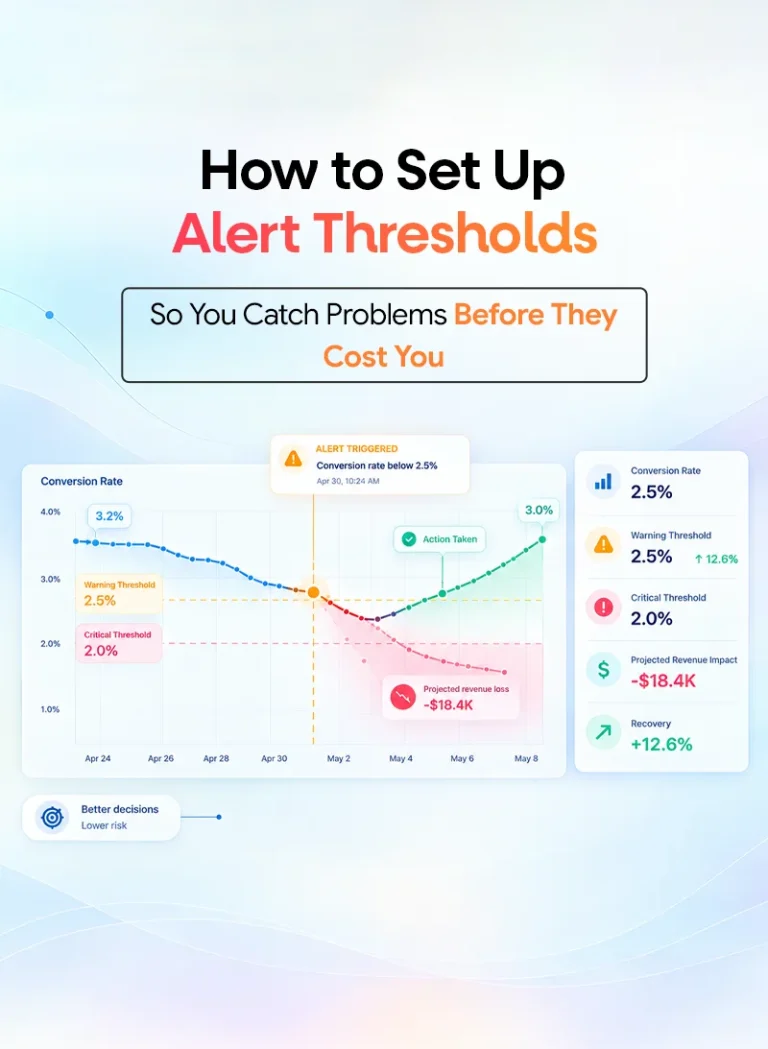
An alert saying:
Conversion below 2.5%
may look useful.
But what if normal Sunday conversion is 2.2% and weekday conversion is 3.1%?
The threshold will create noise.
This is the same principle discussed in Netsights’ guide to KPI alert thresholds: meaningful monitoring begins with a relevant baseline.
For the festive period, establish:
What does normal look like?
How far must performance move before it matters?
Is there enough traffic, orders or spend to trust the signal?
Did the issue last long enough to require action?
Who investigates?
|
KPI |
Compare Against |
Warning Signal |
Owner |
|
Revenue |
Comparable day/time |
Material sustained decline |
Growth |
|
Conversion |
Device-specific baseline |
Unusual sustained drop |
Ecommerce |
|
CAC |
Recent acquisition baseline |
Rising after sufficient spend |
Paid Media |
|
ROAS |
Mature attribution window |
Sustained decline |
Paid Media |
|
Inventory |
Days of cover |
Below lead time |
Operations |
|
RTO |
Normal delivered cohort |
Sustained increase |
Operations |
Do not copy generic threshold percentages blindly.
The real question is:
“At what point would this change alter a business decision?”
Founders who want a smaller executive view can begin with the five ecommerce metrics founders should monitor weekly.
For board or fundraising context, compare them with the ecommerce metrics investors typically look for.
The final checkpoint is operational.
Who looks at the data?
When?
What happens next?
Without that process, even an accurate ecommerce reporting checklist becomes another document.
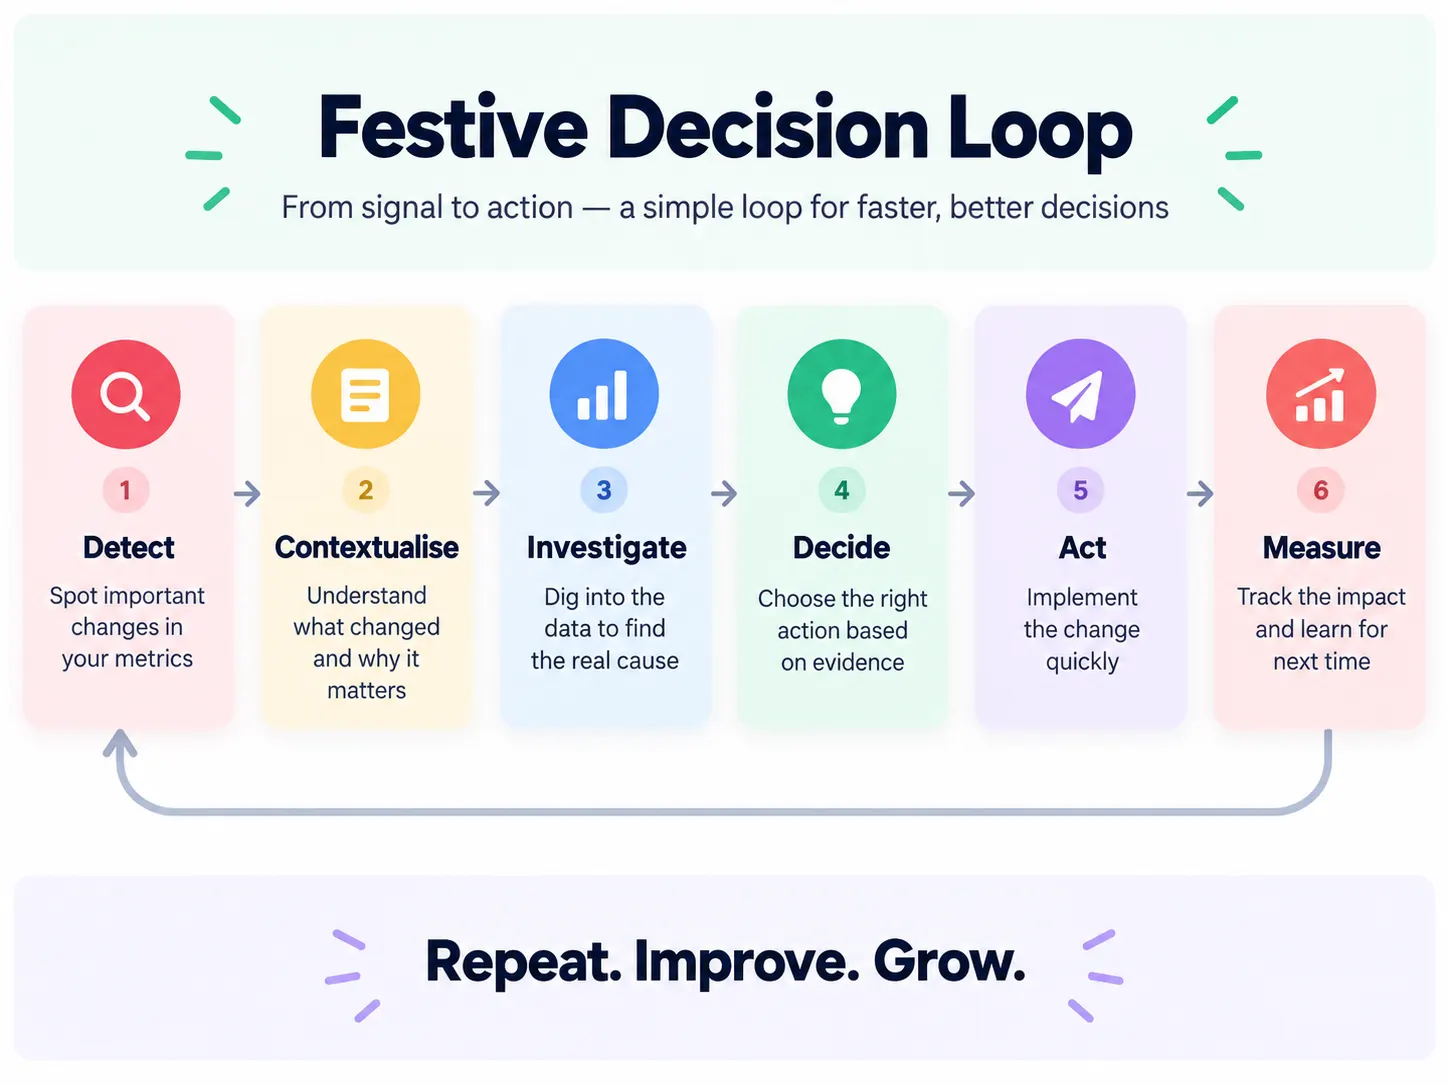
A simple festive routine could work like this.
Review:
Investigate:
Compare the affected metric again.
The loop becomes:
Detect → Contextualise → Investigate → Decide → Act → Measure
This is also why real-time business reporting should not simply recreate yesterday’s spreadsheet faster.
The purpose of faster information is faster action.
The same applies to ecommerce analytics and real-time alerts.
Too much reporting can create decision fatigue when teams are asked to interpret every movement manually.
The festive data problem is rarely:
“We have no data.”
It is usually:
“The data is spread across too many systems.”
Shopify knows the order.
Meta knows the ad interaction.
Google Ads knows another acquisition path.
GA4 knows website behaviour.
Shipping data knows whether the parcel arrived.
Payment systems know whether money was collected.
The Netsights ecommerce analytics platform is designed to connect those signals around business decisions rather than leaving the team to compare separate dashboards manually.
Netification can deliver daily performance summaries and KPI alerts through WhatsApp, Slack or email. Its current product page includes monitoring for revenue, AOV, blended ROAS, traffic, orders, ad spend, conversion rate and product performance.
That helps answer:
“What changed?”
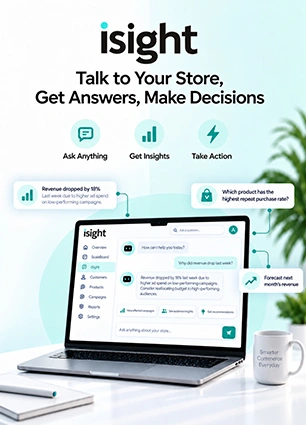
iSight adds the analysis layer.
Its current capabilities include anomaly detection, performance intelligence, inventory-risk modelling, revenue forecasting and analysis across shipping and payment signals.
That moves the question toward:
“Why did it change, how much does it matter, and where should we investigate?”
Netty brings iSight’s analysis into WhatsApp, allowing founders and teams to ask plain-language questions about their store data.
Instead of opening several reports, the interaction can begin with:
The aim is not more analytics.
It is a shorter distance between data and decision.
That also reduces the manual reporting problem explored in Netsights’ guide to cutting ecommerce reporting time from hours to minutes.
Do not wait until Diwali week to test all of this.
Before campaigns scale:
The checklist is not “set and forget.”
Traffic changes
Campaign mix changes
Inventory moves
Customer behaviour shifts
The closer you get to peak festive demand, the more often your assumptions need to be checked.
Festive-season ecommerce moves quickly.
Your measurement needs to keep up.
The strongest ecommerce data analytics setup does not try to make every platform show the same number.
It creates confidence around:
That is the difference between collecting data and using it.
For D2C brands preparing for Diwali, tracking, attribution, inventory, customer value, conversion and post-purchase performance should be checked before spend reaches its peak.
Once those foundations are in place, the team can spend less time asking:
“Which dashboard is right?”
and more time asking:
“What should we do next?”
That is the shift from reporting towards ecommerce decision intelligence.
Ready to bring your ecommerce data into one decision layer?
A: Ecommerce data analytics helps you understand what is happening across sales, marketing, customers and operations so you can make better decisions.
A: Check your tracking, GA4, ad conversions, revenue, UTMs, inventory, checkout, payments, refunds, returns, RTO and key performance metrics.
A: Because each platform measures performance differently. Shopify records actual store orders, while GA4 and ad platforms use their own tracking and attribution methods.
A: Focus on revenue, orders, conversion rate, AOV, CAC, ROAS, inventory, payment success, refunds, returns and RTO.
A: Fast-moving metrics may need to be checked several times a day, while slower metrics like retention can be reviewed less often.
A: It is a check to make sure your sales, product, customer, refund and inventory data is accurate and lines up with your other reporting tools.
A: Netsights brings your ecommerce data together, highlights important changes and helps you understand what needs attention through iSight, Netification and Netty.
We write about growth, retention, and the numbers that actually predict what happens next for D2C brands. Have a topic you'd like us to cover? Get in touch .
Your ecommerce store already contains the answers. Learn how AI ecommerce analytics helps founders ask business questions, understand what changed and why, and move from scattered data to clearer decisions.
Your ecommerce store already contains the answers. Learn how AI ecommerce analytics helps founders ask business questions, understand what changed and why, and move from scattered data to clearer decisions.
Your ecommerce store already contains the answers. Learn how AI ecommerce analytics helps founders ask business questions, understand what changed and why, and move from scattered data to clearer decisions.