
Customer Intelligence: LTV, Churn & Retention
Your best customers aren’t always the ones spending the most today. Customer Intelligence is where you see who’s actually valuable over time, and who’s quietly about to leave.
What it tracks
This section looks at the full lifecycle of a customer, not just their last order. That includes:
- Payback period, how long it takes to earn back what you spent to acquire a customer
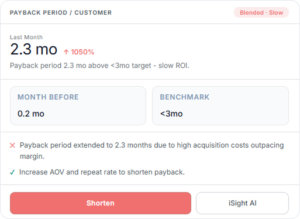
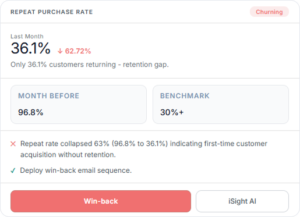
- Repeat purchase rate, how many customers come back for a second order
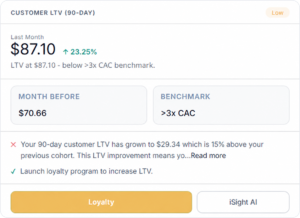
- Customer LTV (90 day), what a customer is worth in their first three months
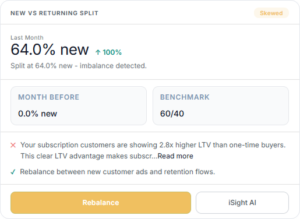
- New vs returning split, whether your revenue is leaning too heavily on new customers
- NPS or review score, a direct read on customer satisfaction
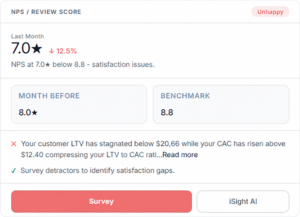
- First to repeat gap, how long it typically takes someone to buy again
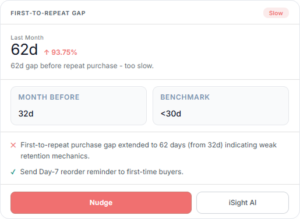
Understanding churn before it happens
One of the more useful things here is churn probability, a forward looking read on which customers are likely to stop buying, based on patterns in the data rather than a guess. Instead of noticing a customer is gone after they’re gone, you get a chance to act while they’re still reachable.
Acting on what you see
Every card here comes with a recommended action, not just a number. If retention is slipping, you might see a suggestion to launch a win back campaign for customers inactive 45 or more days. If new customer acquisition is expensive relative to what they spend, you’ll see a suggestion to invest more in retention instead of acquisition.
Why it’s built this way
Most stores focus heavily on getting new customers and much less on keeping the ones they already have, even though keeping an existing customer is usually cheaper than acquiring a new one. Customer Intelligence exists to keep that balance visible, so retention doesn’t quietly become an afterthought.
A good habit to build
Check your repeat purchase rate and churn probability together, once a week is enough. If one is worsening while the other is rising, that’s usually your earliest warning that something in the post purchase experience needs attention.
Marketing Intelligence: Ads, Spend & Organic Performance
Most marketing dashboards show you what happened. This one tells you which part of your marketing is actually working, and which part is quietly burning money.
How it’s organized
Marketing Intelligence splits into three lenses: Ad Intelligence, Spend Intelligence, and Organic Intelligence. Each looks at the same underlying data from a different angle, so you’re not stuck trying to interpret one giant blended number.

Ad Intelligence
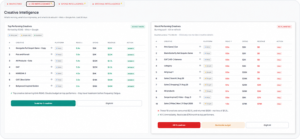
This is where you see individual campaigns ranked by how well they’re actually performing, not just how much they’ve spent. A campaign can look busy and still be losing you money, this is where that gets caught.
Spend Intelligence
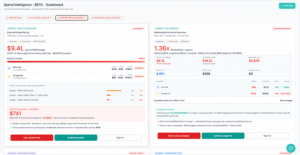
This tracks where your budget is going against where your budget should be going. If several campaigns are consuming most of your daily spend while generating only a small share of your revenue, this is the view that catches it and tells you to shift.
Organic Intelligence
Not everything comes from paid ads. This covers the traffic and revenue you’re earning without spending on it, so you know what’s working organically before you assume paid is the only lever you have.
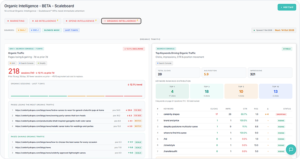
Reading the numbers
A few terms show up constantly here:
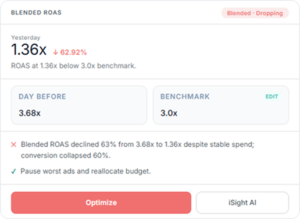
- Blended ROAS, your return on ad spend across every channel combined
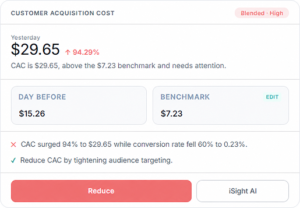
- Customer acquisition cost (CAC), what it actually costs you to win one customer
- Marketing efficiency ratio (MER), how efficiently your total spend is turning into revenue
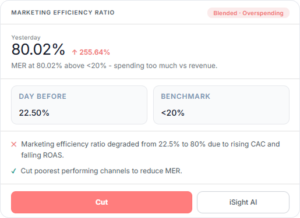
Each of these gets compared against your own benchmark, not an industry average, so what counts as “good” is based on your store’s own history.
Why it’s built this way
Most tools give you one number and expect you to guess what’s driving it. Splitting marketing into ad, spend, and organic performance means you can go straight to the part of the picture that’s actually causing the problem, instead of digging through a blended average that hides where the issue really is.
A good habit to build
When something looks off in your blended numbers, check Ad Intelligence first, then Spend Intelligence. Nine times out of ten, the real story is in one specific campaign or channel, not the whole account.
Team & Account Management
Netsights isn’t built for one person to run alone. Team and account management is how you bring the right people in, and keep control over what they can see and do.
Inviting a team member
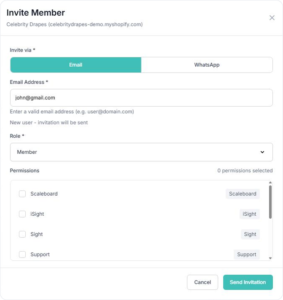
From your account settings, you can invite someone by email. They’ll get a link to join your workspace, and you decide what role they come in with.
Understanding roles and permissions
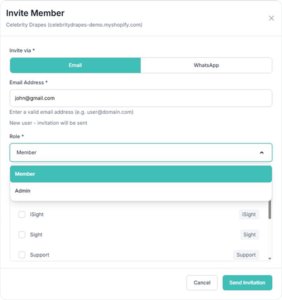
Not everyone on your team needs the same access. Common roles include:
- Owner, full access, including billing and the ability to remove other people
- Admin, can manage integrations, settings, and most day to day configuration
- Editor, can work with reports, alerts, and dashboards, but can’t touch billing or account level settings
- Viewer, can see dashboards and reports, without the ability to change anything
Giving someone the right role matters more than it seems. A Viewer who accidentally gets Admin access can change settings they didn’t mean to touch.
Managing multiple stores under one account
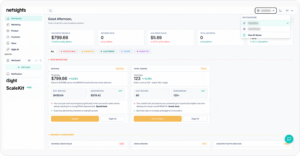
If you run more than one store, they can all live under a single account instead of separate logins. You can switch between them, and decide whether team members see all stores or just the ones relevant to them.
Transferring account ownership
If the person who originally set up the account is leaving, ownership can be transferred to someone else on the team. This needs to be done deliberately, since the Owner role controls billing and the ability to remove anyone else.
Removing a team member
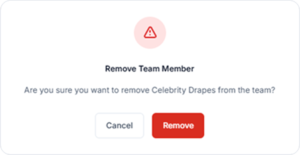
When someone leaves, removing their access takes one step from account settings. It’s worth doing promptly, not just when it’s convenient, especially if that person had Admin level access.
Why it’s built this way
A growing team means more people touching the same data. Roles exist so that access grows carefully, not by accident, one person having too much access is usually how mistakes happen, not too little.
A good habit to build
Review who has access every few months, not just when someone joins or leaves. It’s an easy thing to forget, and the easiest way an old teammate ends up with access they shouldn’t still have.
Reports: Daily, Weekly & Monthly
Not everyone wants to log in and dig through a dashboard every day. Reports are for that. They come to you on a schedule, instead of waiting for you to go looking.
Understanding your daily report
Every morning, you get a short summary of how your store did the day before, revenue, orders, and the one thing that actually needs your attention. It’s built to be read in under a minute, not studied.
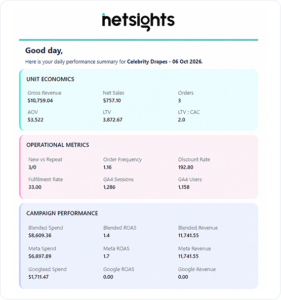
Here’s roughly what it looks like: “Good morning. Revenue: $28,400, up 8% versus last week. Top issue: your bestseller SKU is running low. Restock within 48 hours to avoid a stockout.” That’s the whole report. No login required to get that far.
Setting report frequency and delivery channel
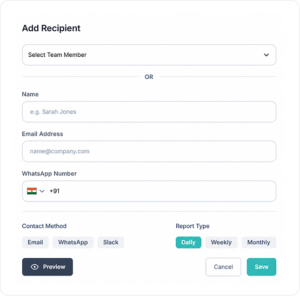
You can choose how often you want a report, daily, weekly, or monthly, and where it should land, email, WhatsApp, or Slack. Higher tier plans also unlock quarterly, half yearly, and yearly reports, useful for board level reviews rather than day to day checking.
Building a custom report
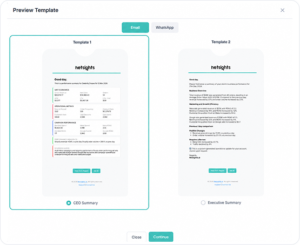
If the default report doesn’t cover what you care about, you can build your own. Pick the metrics that matter to your business, and Netsights assembles a report around exactly those, instead of a generic template built for everyone.
Sharing a report with your team
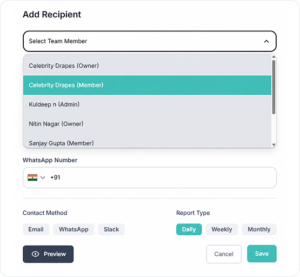
Reports can be shared directly with anyone on your team, so the same numbers reach the people who need them without you having to forward anything manually.
Quarterly, half yearly, and yearly reports
These longer cycle reports are built for a different purpose than the daily or weekly ones. They’re meant for a board meeting or a leadership review, not a quick morning check, so they go deeper into trends over time rather than a single day’s numbers.
Why it’s built this way
A report shouldn’t require you to remember to check something. It should show up already knowing what you need, on the schedule that actually fits how you work.
A good habit to build
Start with a daily report if you’re hands on with the business day to day, and add a monthly or quarterly one once you need something to bring to a bigger conversation, like a board update or an investor check in.
Setting Up Alerts & Notifications
You shouldn’t have to go looking for problems. Alerts are how Netsights comes looking for you instead.
An alert is a rule you set once, on a metric that matters to your business. The moment that metric crosses the line you set, you get notified, wherever you’ve asked to be notified.
Setting up your first alert
1. Pick a metric you care about, revenue, ad spend, conversion rate, checkout failures, anything tracked in ScaleBoard.
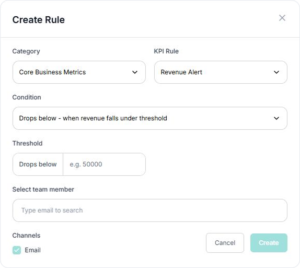
2. Set a threshold, the point at which you want to be told something’s off.
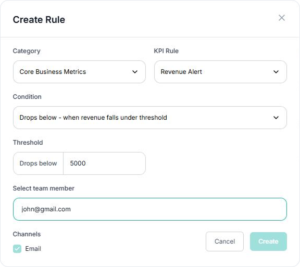
3. Choose how you want to hear about it.
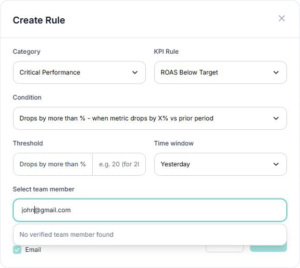
4. Save it, and it runs in the background from that point on.
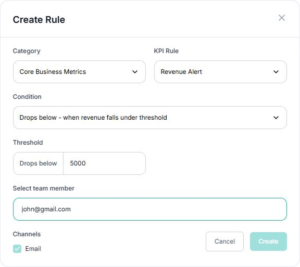
Choosing delivery channels
You can send alerts to email, WhatsApp, or Slack, or a combination of them. A good rule of thumb: use email for things you’ll check later, and WhatsApp or Slack for anything you’d want to know about immediately.
Routine vs critical alerts
Not every alert deserves the same urgency. A metric drifting slightly outside its usual range is routine, worth knowing, not worth panicking over. A metric crossing a threshold that actually threatens revenue or checkout is critical, and should probably go to a channel you check constantly, not just email.
If more than a few critical alerts stack up while you haven’t logged in, Netsights escalates that on its own, since that usually means something bigger is going on than any single alert by itself.
Alert limits by plan
Lower tier plans have a cap on how many alerts you can run at once. If you’re hitting that limit, it’s usually a sign you’ve outgrown the plan you’re on, not that you’re doing something wrong.
If an alert doesn’t fire when you expected
Double check the threshold you set, it’s easy to set a number too high or too low the first time. Also confirm the delivery channel is still connected, especially WhatsApp and Slack, which occasionally need to be reauthorized.
Why it’s built this way
Checking a dashboard is something you have to remember to do. An alert doesn’t rely on your memory. It’s built for the exact moment you’re busy with something else and can’t afford to notice a problem late.
A good habit to build
Start with two or three alerts on the metrics that would actually hurt if they went unnoticed for a week. You can always add more once you see how the first few behave.
Using iSight AI
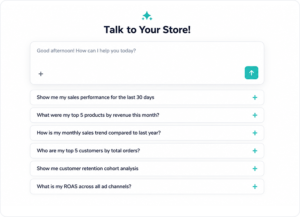
Most people don’t have time to open a dashboard and hunt for an answer. iSight AI skips that step entirely. You ask a question in plain language, and you get a direct answer back, pulled from your actual store data.
How it works
- Ask a question, type it like you’d ask a person, no special format needed.
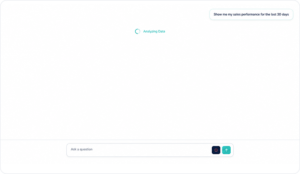
2. iSight reads your connected data in real time (Shopify, Meta Ads, Google Ads, GA4, whatever you’ve connected).
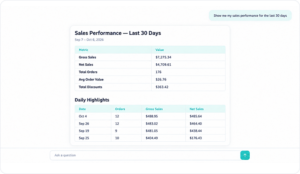
3. You get an answer, along with how confident iSight is in it, what data it used, and when that data was last updated.
You can ask iSight from inside the app, or send it a message on WhatsApp if you’re away from your desk.
When to use it
- You’re between meetings and only have a minute
- You’re checking in from your phone, not at a computer
- You want one specific answer, not a full report
- You want to know if anything needs your attention right now, without opening the dashboard
Example questions
- “Why did my AOV drop last week?”
- “What’s my ROAS across all channels?”
- “Should I worry about anything today?”
- “How did we do yesterday?”
Types of questions iSight handles
- Diagnostic, “why did this happen,” iSight explains the cause
- Predictive, “what’s coming,” iSight flags what’s likely next
- Advisory, “what should I do,” iSight recommends the next move, not just the number
Tips for better answers
- Be specific. “Why did AOV drop last week?” gets a sharper answer than “how’s business?”
- Check the confidence score and data sources if you want to verify an answer
- You can ask follow up questions in the same conversation, iSight remembers the context
- Use WhatsApp for quick checks on the go, use the in app version when you want to see the numbers laid out visually too
Why it’s built this way
Most tools ask you to already know what you’re looking for. iSight flips that. You don’t need to know which report to open or which filter to apply, you just ask what you actually want to know, the way you’d ask a colleague.
A good habit to build
Next time you catch yourself about to open five tabs to answer one question, ask iSight instead. It’s usually faster, and you’ll get used to trusting it the more you use it.
Understanding ScaleBoard
Most dashboards hand you a wall of charts and leave you to figure out what matters. ScaleBoard doesn’t work that way.
Every morning, it looks at your store’s data and tells you two things: what went wrong, and what to do about it. Not forty metrics to sort through, just the handful that actually need your attention today.
How ScaleBoard is organized
ScaleBoard is split into six areas, each covering a different part of your business:
- Marketing, your ad spend, campaign performance, and where your budget is actually working
- Product, margins, SKU performance, and pricing health
- Customer, who’s coming back, who’s at risk of leaving, and what they’re worth over time
- Store, conversion rates, cart abandonment, and checkout friction
- iSight AI, your predictive layer, catching things before they become problems
- Payment, whether transactions are actually going through, and why they might not be
You can look at all six together, or filter down to just the one you care about right now.

Reading a card
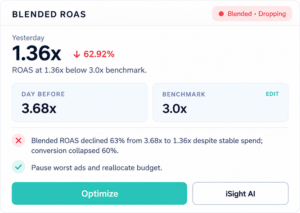
Every card on ScaleBoard follows the same simple shape.
A status badge tells you at a glance how serious this is. Something marked “Critical” needs your attention before something marked “Healthy.”
A number, with how it compares to yesterday and to your own benchmark. This is where you see if something’s actually off, not just different.
A short explanation, in plain language, of what’s happening and why. No jargon, no digging required.
A recommended action, already worked out for you. Not “here’s a chart, good luck,” but “here’s the actual fix.”
If you want to go deeper on any card, there’s an iSight AI button that lets you ask a follow up question right there. And if a problem needs more than a quick fix, a Hire a Pod option connects you with a real person who can help you act on it.
Why it’s built this way
The point of ScaleBoard isn’t to show you everything. It’s to shorten the distance between “something happened” and “I know what to do about it.” Most tools stop at the first part. ScaleBoard is built to get you to the second part every single day, without needing to become an analyst yourself.
A good habit to build
Check ScaleBoard once in the morning before you open anything else. Most days, there’ll be one or two things worth five minutes of your time. Some days there won’t be much at all, and that’s a good sign too.
Netsights Knowledge Base
Netsights provides unified, AI-powered performance visibility for Shopify brands. It transforms complex store data into clear, actionable Sights™ tailored to different leadership roles.
Key Capabilities
- Unified Shopify performance visibility
- Role-based Sights for:
- CEOs
- CMOs
- CFOs
- COOs
- Custom insight cards and KPIs
- AI-driven context and predictive signals
- Real-time and historical performance analysis
Getting Started with Netsights
Create Your Account
- Visit localhost/netsights/
- Click Request Early Access or Install on Shopify
- Sign in using your Shopify store
- Complete the onboarding process
Once connected, Netsights begins pulling performance data and generating Sights automatically.
Customizing Your Insights
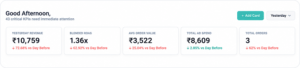
- Click + Add Cards to choose which Insights you want to view
- Filter data by date and time range
- Arrange cards based on your priorities and role