
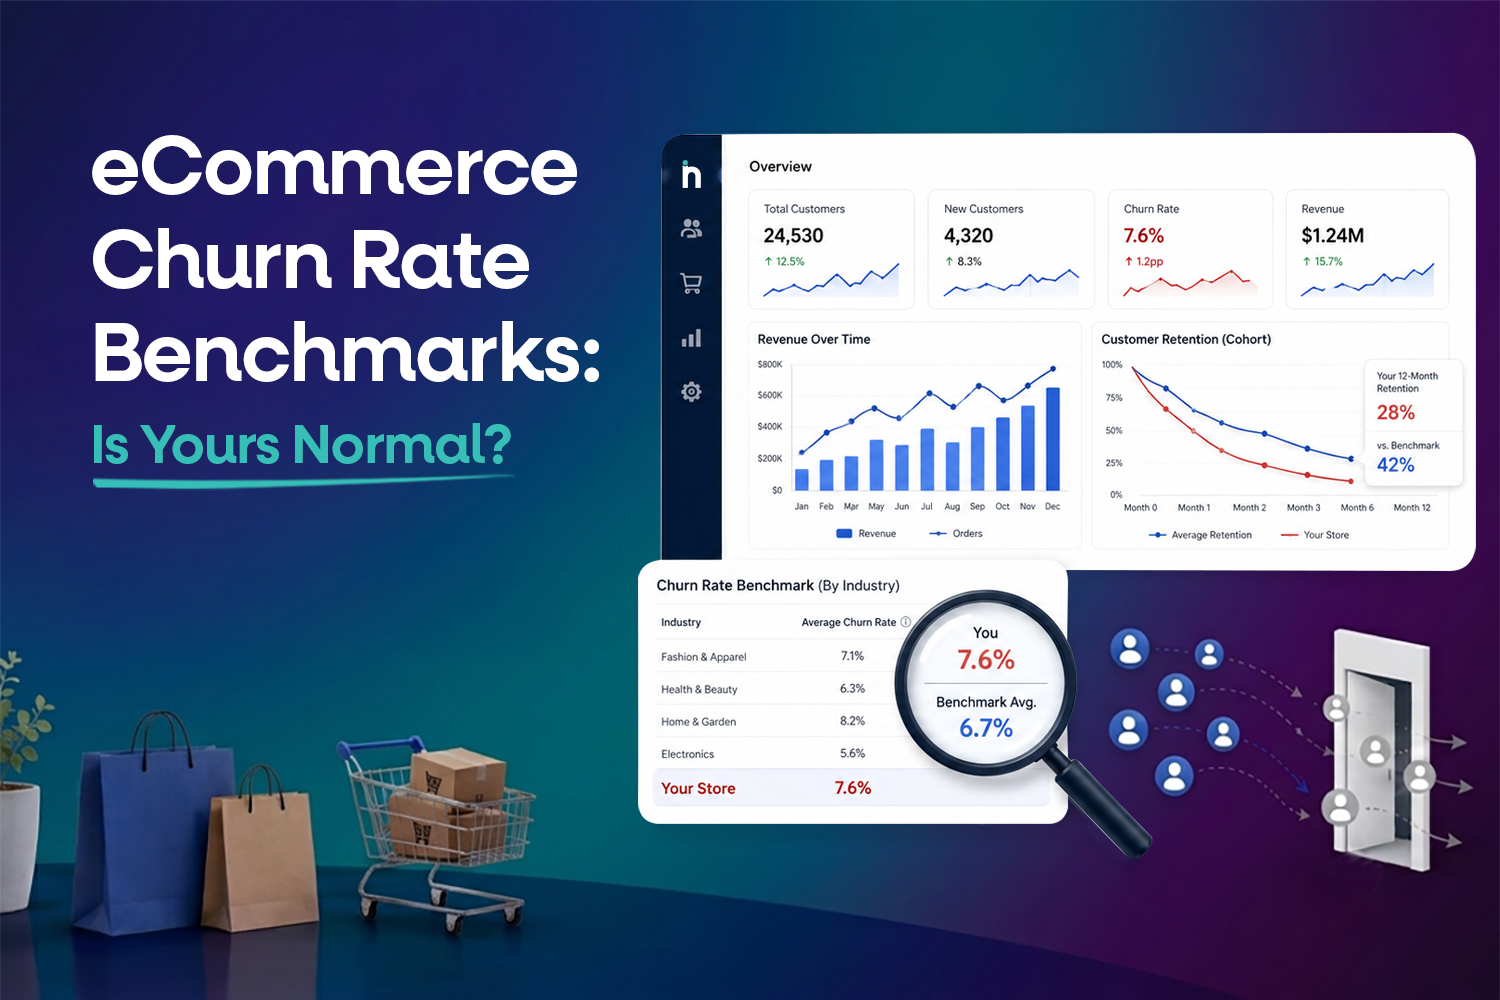
Every ecommerce founder eventually asks the same question: “Are customers coming back often enough?”
That is where eCommerce churn rate benchmarks become useful, but also tricky.
Your churn rate may look high at first glance. But if you sell furniture, jewellery, luxury sarees, or high-ticket products, customers may naturally take longer to return. If you sell skincare, supplements, pet food, snacks, or daily-use products, the same churn rate could be a warning sign.
This is why there is no single “normal” ecommerce churn rate for every brand. Churn depends on your category, product price, purchase cycle, acquisition source, discounting strategy, and customer experience.
So the real question is not just, “Is my churn rate normal?”
The better question is:
“Is my churn rate normal for my business model, category, and customer behaviour?”
There is no universal ecommerce churn rate benchmark.
For many ecommerce brands, a retention rate around 20% to 40% is often used as a broad reference point, but Shopify notes that retention varies significantly by industry and product type. Subscription ecommerce brands may naturally show different retention patterns because customers are billed repeatedly, while non-subscription stores depend on repeat purchase behaviour.
In simple terms, your churn rate is only “normal” when it is compared against the right context.
A 70% churn rate may be worrying for a monthly consumable brand. The same number may be less alarming for a brand selling premium occasion wear, furniture, or wedding jewellery where repeat purchases happen less frequently.
Most ecommerce brands want one simple answer.
They want to know whether their churn rate is good or bad.
But churn is not that straightforward.
A coffee subscription brand, a skincare brand, a fashion store, a jewellery brand, and a furniture brand cannot use the same benchmark. Their customers buy at different speeds. Their products solve different needs. Their price points are different. Their natural purchase cycles are different.
This is why ecommerce churn rate benchmarks should be used as a guide, not a final judgment.
For example:
A customer who does not repurchase within 30 days may be a churn risk for a protein snack brand. But a customer who does not repurchase within 30 days from a premium saree brand may not be churned at all. They may simply not need another saree yet.
That is the first mistake brands make.
They define churn too early.
Ecommerce churn rate measures the percentage of customers who stop buying from your store during a specific period.
In subscription ecommerce, churn is easier to define. If a customer cancels a subscription, skips too many cycles, or fails payment and does not recover, they have churned.
In non-subscription ecommerce, churn is harder to define because customers do not formally cancel. They simply stop buying.
That means you need to define churn based on your purchase cycle.
If your average customer buys every 45 days, then 90 days without a repeat purchase may be a churn signal. If your average customer buys every 180 days, then a 90-day gap may still be normal.
This is why ecommerce churn analysis should always begin with customer behaviour, not a generic benchmark.
The basic churn formula is:
Customer Churn Rate = Customers Lost During Period ÷ Customers at Start of Period × 100
But ecommerce brands need to be careful with the word “lost.”
In a subscription business, lost customers are easier to identify.
In non-subscription ecommerce, you need to define a churn window. This could be 60 days, 90 days, 180 days, or 365 days depending on your product category.
For example:
If you had 1,000 customers at the beginning of a period and 700 did not buy again within your defined churn window, your churn rate would be 70%.
But that number is only useful if the churn window matches your actual buying cycle.
If the window is too short, churn will look worse than it is. If the window is too long, churn problems may be detected too late.
A better way to benchmark churn is by business type.
Here is a practical way to think about it:
Business Type | Churn Interpretation |
Subscription ecommerce | Monthly churn is easier to track because customers actively subscribe or cancel |
Consumables | Lower churn is expected because products need replenishment |
Fashion and lifestyle | Churn varies heavily by season, offer, trend, and product cycle |
Luxury and premium products | Higher apparent churn may be normal because purchase frequency is lower |
High-ticket products | Repeat purchase may take months or years |
Discount-led stores | Churn may be higher because customers return mainly for offers |
Subscription ecommerce brands should pay close attention to monthly churn, voluntary churn, involuntary churn, failed payments, and cancellation reasons. Even within subscription businesses, churn benchmarks vary depending on the product category, pricing model, billing frequency, and customer purchase behaviour.
For non-subscription ecommerce, customers do not actively cancel, making churn harder to define. Instead, brands should focus on repeat purchase rate, cohort analysis, purchase frequency, and customer lifetime value to understand long-term customer retention.
Churn rate and retention rate are connected, but they look at opposite sides of customer behaviour.
Retention rate tells you how many customers stayed or bought again.
Churn rate tells you how many customers stopped buying.
If your retention rate is 30%, your churn rate is roughly 70%, assuming you are measuring the same customer group and same period.
But in ecommerce, this can become complicated because customers do not always buy on a fixed schedule.
That is why retention rate is often easier for founders to understand.
If 1,000 customers bought in January and 300 bought again within 90 days, the 90-day repeat retention is 30%.
But whether that is good or bad depends on what you sell.
Repeat purchase rate is one of the most practical retention metrics for ecommerce brands.
It tells you what percentage of customers buy more than once.
The formula is:
Repeat Purchase Rate = Customers With More Than One Purchase ÷ Total Customers × 100
If your repeat purchase rate is low, churn is probably high.
But again, context matters.
A low repeat purchase rate may be a serious issue for a skincare brand. For a bridal saree brand, it may simply reflect a longer buying cycle.
Shopify defines customer retention rate as the percentage of current customers who make repeat purchases over a specific period, which is why the chosen time period matters so much.
For ecommerce founders, repeat purchase rate is often the easiest weekly or monthly signal to start with.
This is why it should sit beside churn, LTV, CAC, and revenue quality in your reporting. For a broader founder-level view, this guide on weekly ecommerce metrics for founders is a useful next read.
Related Read: The Founder’s Weekly Check-In: 5 Metrics to Review Every Monday
Your churn rate may look worse when your measurement window is too short.
This happens often in categories with longer purchase cycles.
For example:
If you sell luxury fashion, premium jewellery, occasion wear, furniture, or gifting products, customers may not return every month. A 60-day churn window may label healthy customers as churned too early.
The churn rate might also be worse for your brand since you have acquired many first-time buyers using paid campaigns recently. It takes time for new customers to transition to their second purchase.
It is because churn cannot be analyzed alone.
It needs to be analyzed together with repeat purchase rate, cohorts, customer acquisition channel, and product categories.
If you are drowning in multiple dashboards but do not understand what the numbers mean, then this article on how to stop drowning in data and make decisions will help.
Related Read: How to Stop Drowning in Data and Start Making Decisions
Sometimes churn looks fine, but the business is still weak.
This usually happens when repeat purchases are driven by heavy discounts, not real customer loyalty.
If customers only return during sales, your retention may look healthy on the surface. But your margins may be shrinking.
Your churn rate may also look better if you are only looking at total customers instead of cohorts.
For example:
New customer acquisition may hide poor repeat behaviour. Revenue may keep growing because paid ads are bringing new buyers, but older customer cohorts may not be returning.
That is dangerous.
It means acquisition is covering up retention problems.
This is where CAC vs LTV for D2C profitability becomes important. If your customer acquisition cost is rising and customers are not returning often enough, churn becomes a profitability problem, not just a retention problem.
Related Read: CAC vs LTV: The Ratio That Determines If Your D2C Brand Can Scale Profitably
See how NetSights helps you spot retention issues before they affect revenue.
Connect your Shopify store, marketing channels, and key ecommerce metrics in one decision-ready view.
High ecommerce churn usually happens when customers do not see enough reason to come back.
Sometimes the product does not need frequent replenishment. Sometimes the first experience was weak. Sometimes delivery was slow, product quality was inconsistent, support was poor, or post-purchase communication was missing.
In many cases, churn is caused by silence after the first order.
A customer buys once. They receive the product. Then nothing meaningful happens.
No education. No replenishment reminder. No product recommendation. No loyalty trigger. No win-back sequence. No personalisation.
Retention does not happen automatically.
It has to be designed.
Bain’s widely cited retention research shows why this matters: increasing customer retention rates by 5% can increase profits by 25% to 95%, depending on the business context, as cited by Harvard Business Review.
All customers do not churn at the same speed.
Customers that were acquired by using branded search could behave in such a way that they could be different from those customers that were acquired via the Meta ads campaigns at a discount.
Similarly, those customers who were acquired via organic search will be different from other customers who were acquired through flash sales campaigns.
That is why it makes sense to analyze the churn based on different acquisition channels.
If one’s Meta Ads campaigns acquire many new customers but few return customers, then maybe the problem is not conversion-related, but quality of customers-related.
And if customers acquired through Google Ads repeat their purchases, then the high CAC is justified.
That is why ecommerce teams need more than just channel-level ROAS. They need to understand how different acquisition channels impact retention, repeat purchase rate, and LTV.
If one’s team is still experimenting with their campaigns, then one should have a look at this article on A/B testing ROAS in ecommerce.
Related Read: A/B Testing Framework: How We Run Tests That Actually Impact ROAS
Discounts can drive traffic fast.
However, discounts cannot always guarantee loyal customers.
A customer who purchases a product only due to a 40% discount will wait until the next offer appears, and if there is none, he/she will leave.
It leads to a situation when the brand continues to use discounts in order to reactivate customers while its margins become weaker and weaker.
The churn problem becomes less visible.
While the customer will indeed return, it is going to be profitable.
That is why brands need to ask not only “did the customer return?”
But also “did the customer return profitably?”
Cohort analysis is one of the best ways to understand ecommerce churn.
Instead of looking at all customers together, cohort analysis groups customers based on when they first purchased.
For example, you can compare customers acquired in January, February, and March. Then you can see how many customers from each month purchased again after 30, 60, 90, or 180 days.
This helps you see whether retention is improving or getting worse.
It also helps answer better questions.
Are customers acquired during sale periods churning faster?
Are first-time buyers from Meta Ads returning less often than customers from Google Ads?
Are customers who buy certain products more likely to return?
A regular dashboard may show total revenue. A better system shows whether the customer base is becoming healthier.
This is the difference between reporting and ecommerce decision intelligence.
Related Read: What Is eCommerce Decision Intelligence and Why Does It Matter?
Stop guessing why customers aren’t coming back.
Track customer cohorts, repeat purchases, and retention trends with NetSights.
Stop guessing why customers aren’t coming back.
Track customer cohorts, repeat purchases, and retention trends with NetSights.
Here is an illustrative example using realistic ecommerce numbers.
Let’s say an ecommerce brand acquired 1,000 new customers in January.
After 90 days, only 280 customers purchased again.
At first, this looks like a 72% churn rate.
That may seem alarming.
But the meaning depends on the category.
If the brand sells monthly skincare refills, 72% churn after 90 days is a serious warning sign. Customers should be returning faster.
If the brand sells premium occasion wear, 72% non-repeat behaviour after 90 days may be less concerning because the natural purchase cycle is longer.
Now imagine the same brand checks six-month cohorts and sees this:
Customer Segment | 90-Day Repeat Rate | 180-Day Repeat Rate | Interpretation |
Skincare refills | 28% | 42% | Needs stronger replenishment and retention flows |
Premium sarees | 12% | 24% | May be normal if purchase cycle is longer |
Discount campaign buyers | 18% | 20% | Weak customer quality |
Full-price buyers | 22% | 38% | Healthier long-term segment |
This is why churn benchmarks are useful, but cohort behaviour is more useful.
Benchmarks tell you where you might stand.
Cohorts tell you what is actually happening.
Churn reduction starts after the first purchase.
The first purchase is going to set the ball rolling towards a retention journey.
A retention journey may include activities like educating your customers about using your product, getting them to review the product, reminding them about the order, suggesting the right products, promoting loyalty and conducting winback campaigns.
But all of this will depend on the type of your product.
Your customers may need replenishment for the beauty products they have purchased but may need some styling tips for clothing items and some suggestions for accessories.
Here the idea is to stay relevant post-purchase.
The customers will buy again only if the brand stays relevant for them and doesn’t sell to them continuously.
If the effort to reduce the churn is delayed till acquisition generates income for you, the hidden cost is going to increase tremendously.
Churn should never be tracked alone.
A better retention view includes repeat purchase rate, customer retention rate, LTV, CAC, purchase frequency, average order value, cohort revenue, discount dependency, refund rate, return rate, and win-back performance.
The point is not to create a heavier dashboard.
The point is to answer better questions.
Are customers coming back? Are they coming back profitably? Which products bring repeat buyers? Which campaigns bring low-retention customers? Which cohorts are improving? Which customers need attention before they churn?
If your current dashboard only shows numbers without action, this comparison of ecommerce dashboard vs Scaleboard will help you understand why decision-ready analytics matters.
Related Read: NetSights vs Ecommerce Dashboards: Scaleboard Difference
Churn rarely happens overnight.
It happens slowly.
Repeat purchase ratio declines. Time to repurchase grows. Email engagement falls. Dependency on discounts increases. High-value customers go silent. Win back programs fail to convert.
If teams only rely on financial metrics, they may miss these early warning signs.
This is where Netsights helps ecommerce teams bring marketing, product, retention, and financial metrics into a clearer decision-making process.
iSight ecommerce analytics gives teams a unified view of store performance, retention trends, and customer behaviour signals.
Netification KPI alerts notify teams when important changes happen across retention and revenue performance.
Netty AI ecommerce assistant helps teams ask questions about churn, repeat buyers, cohorts, and growth without manually moving between dashboards.
The objective is not to add more data but to provide more actionable data.
Ecommerce churn rate benchmarks are useful, but they are not the full answer.
Your churn rate is only meaningful when it is compared against your product category, purchase cycle, customer source, retention strategy, and business model.
A high churn rate may be normal for a low-frequency product. A moderate churn rate may be dangerous for a consumable product. A strong repeat purchase rate may still be weak if it depends heavily on discounts.
That is why ecommerce brands should not chase one universal benchmark.
They should build a retention view that connects churn, repeat purchase rate, LTV, CAC, cohorts, margin, and customer behaviour.
Churn is not just a number.
It is a signal.
And the faster you understand what that signal means, the faster you can protect growth.
A: There is no single good churn rate. It depends on your product category, purchase cycle, pricing, and business model.
A: Divide customers lost during a period by customers at the start of that period, then multiply by 100.
A: Yes. Churn rate shows customers who stopped buying, while retention rate shows customers who came back.
A: Churn rate shows customer loss. Repeat purchase rate shows how many customers bought more than once.
A: Because every category has a different buying cycle. Skincare, fashion, furniture, and luxury products cannot use the same churn benchmark.
A: Improve post-purchase communication, use reminders, offer relevant recommendations, build retention journeys, and track repeat purchase behaviour.
A: Poor product experience, weak follow-up, slow delivery, high returns, discount-only buyers, or lack of personalised retention efforts.
A: Yes. Subscription brands should track cancellations, failed payments, skipped orders, voluntary churn, and involuntary churn.
We write about growth, retention, and the numbers that actually predict what happens next for D2C brands. Have a topic you'd like us to cover? Get in touch .
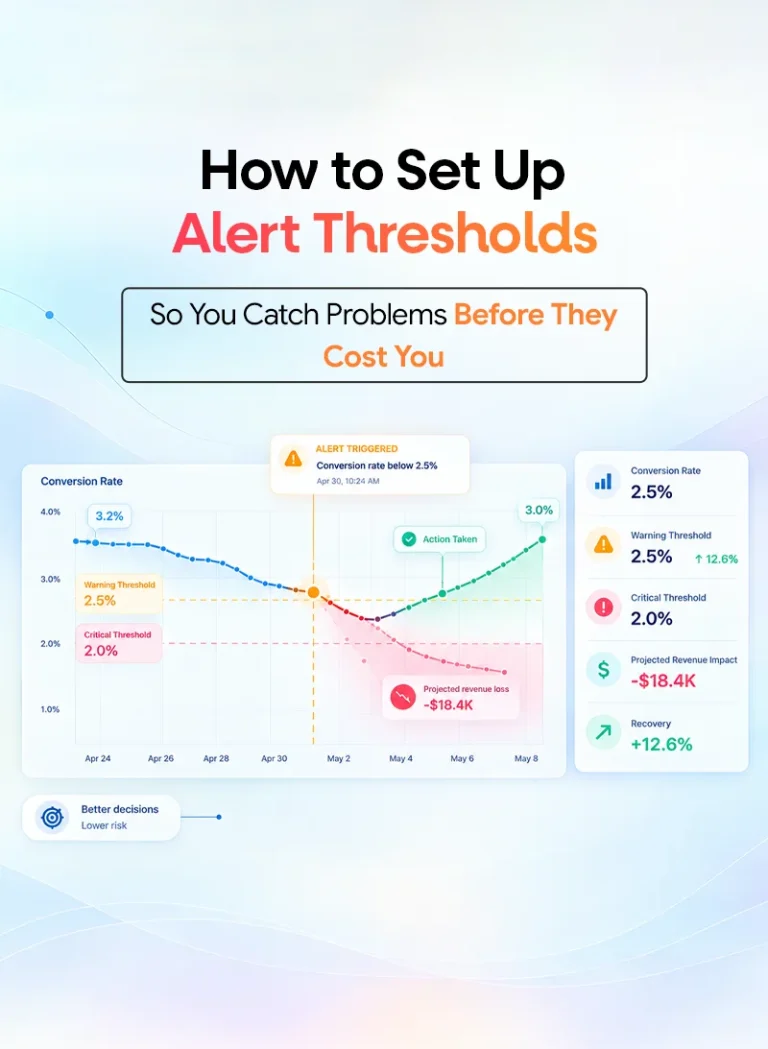
Your ecommerce store already contains the answers. Learn how AI ecommerce analytics helps founders ask business questions, understand what changed and why, and move from scattered data to clearer decisions.
Your ecommerce store already contains the answers. Learn how AI ecommerce analytics helps founders ask business questions, understand what changed and why, and move from scattered data to clearer decisions.
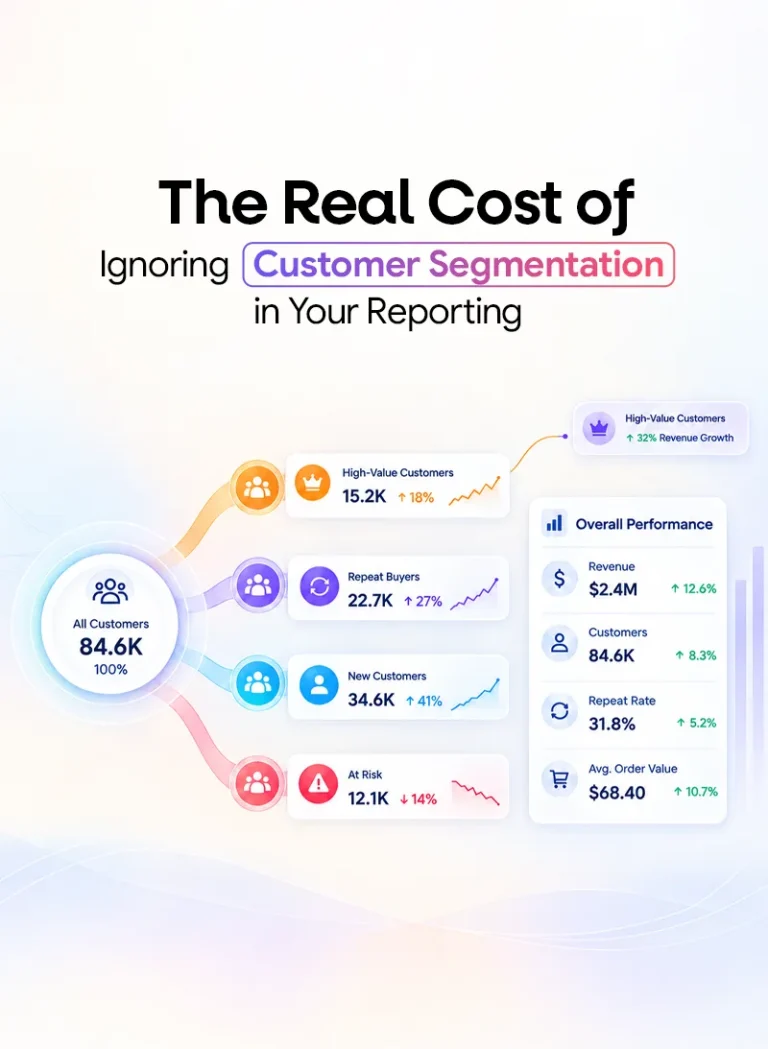
Compare Shopify conversion rate benchmarks by industry, device, traffic source, and customer type. See what a good conversion rate looks like in 2026 and learn how to benchmark your store more accurately.