
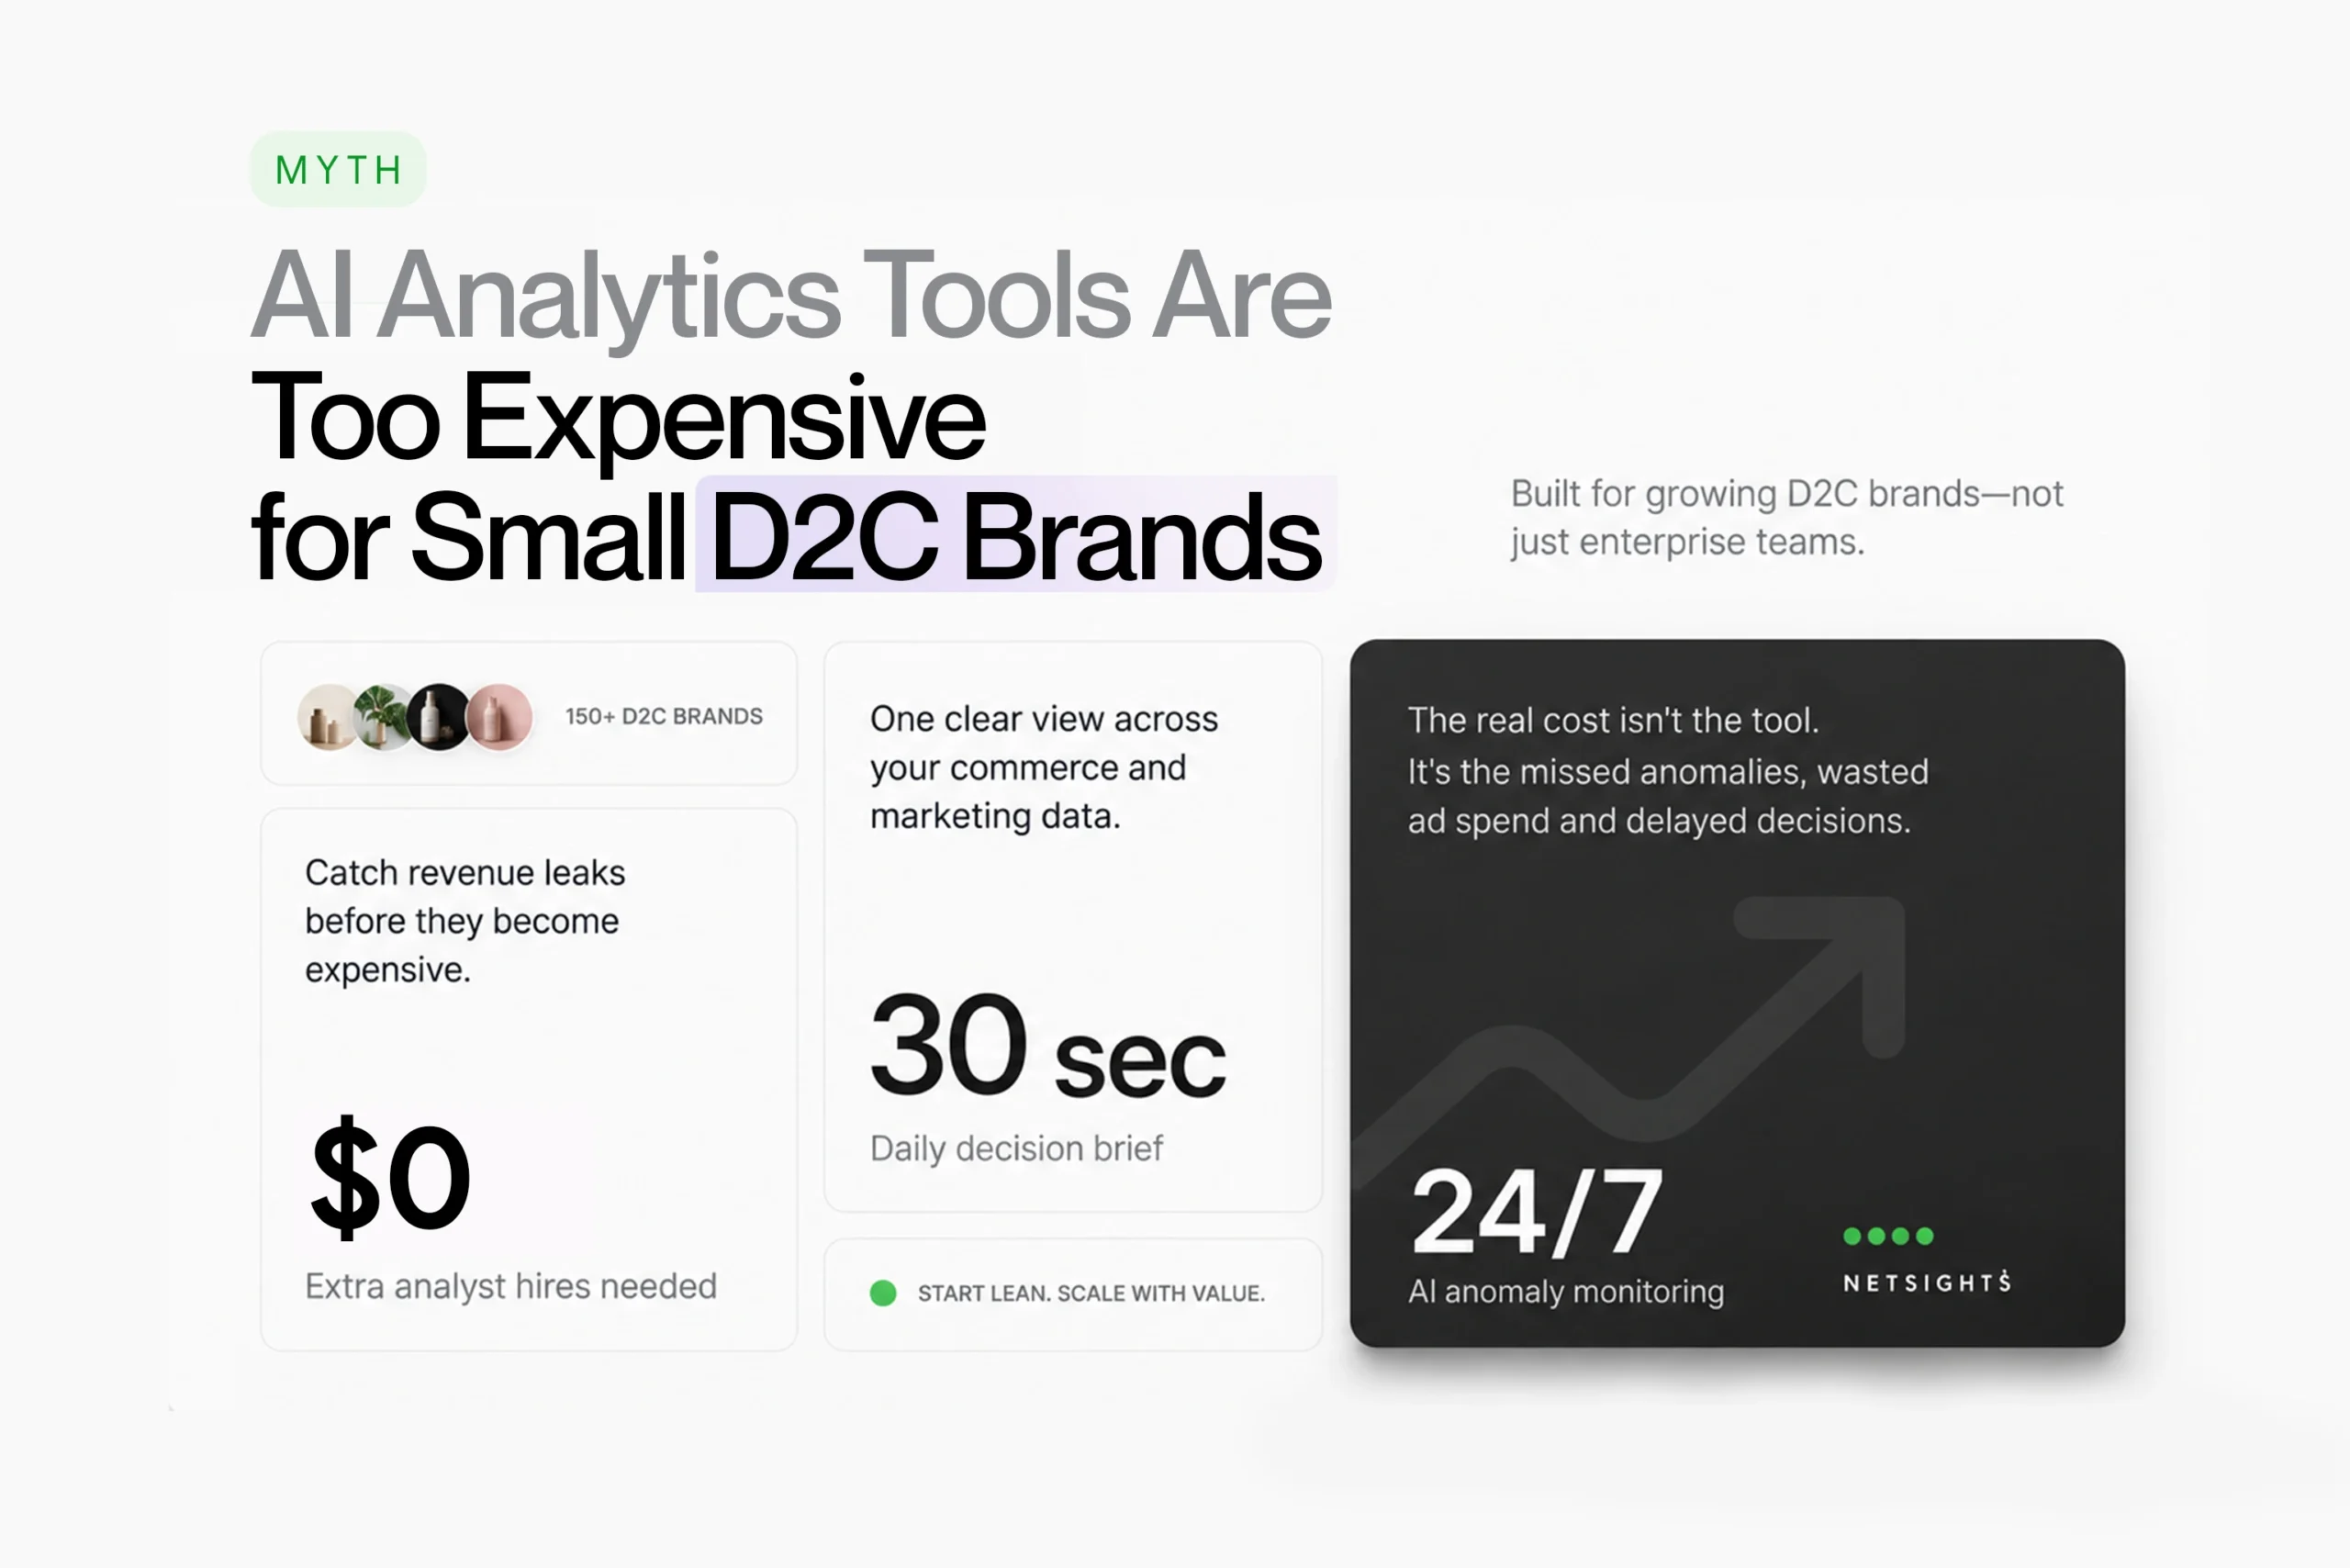
Every dollar matters when running a small D2C brand.
Inventory needs to be managed, ad budgets spent, orders shipped, and customers served. It is hard not to feel reluctant about another subscription in monthly costs. Therefore, it is only natural to doubt the usefulness of AI analytics in that case.
Traditionally, analytics was something big companies could afford, along with expensive business intelligence systems and dedicated data analysts. It was quite natural for smaller e-commerce companies to think that these features should become a priority only once they reached a certain turnover level.
But this picture is changing. Nowadays, AI analytics can be acquired through the same subscription software that allows tracking performance, automating reports, detecting abnormalities, and making better-informed decisions.
The point here is that being cheap does not mean being ineffective and vice versa. Affordable analytics tools are just as good, and sometimes even better than more expensive ones. For small D2C companies, the issue of AI analytics is not the cost, but its ability to save time and money.
The idea that AI analytics is meant to be used only by large companies has its origins in history.
Traditional BI software was often geared towards companies dealing with huge volumes of information in different departments. In turn, implementing such software would require customization, specialized analysts, integration processes, and long periods of implementation.
A small direct-to-consumer company will not have enough resources to make such an investment. Today’s analytics marketplace provides a wider range of options. There are some tools focusing on performance reporting, others offer ecommerce analytics, predictive models, anomaly detection, and AI recommendations. The difference is in the real needs of the company.
For instance, a fashion brand with $30,000 monthly earnings on the Internet depends entirely on the founder to control Meta Ads, monitor Shopify sales, and analyze the website in Google Analytics 4, with a great deal of manual reporting involved.
In comparison, a multi-country and multi-channel retailer is bound to have completely different analytics needs. While the need for correct data remains in both cases, the analytical requirements are quite different.
For the smaller brand, it will probably mean asking such questions as:
– What campaigns bring us profitable clients?
– Why have conversions dropped today?
– Are we spending too much on new client acquisition?
– Which products stop working?
– What do we need to concentrate on this week?
Answering these questions does not necessarily imply an expensive enterprise analytics solution. The key point is the data itself and the capability to make decisions from it. That is why the concept of ecommerce decision intelligence becomes more important than mere metric collection.
AI analytics software does not come with one-size-fits-all pricing. This is because prices depend on a variety of factors such as features offered, number of users, data sources, frequency of reporting, and level of customization needed.
Reporting software could end up being less expensive compared to business intelligence tools. Some companies could charge extra for more advanced forecasting and more data.
Understanding the Total Cost of Analytics Software
When choosing affordable analytics software, the total cost of ownership should be considered, not just the listed price.
|
Cost component |
What it means for your business |
|
Monthly subscription |
Recurring platform charges |
|
Initial setup |
Time or fees required to configure the software |
|
Data integrations |
Cost of connecting stores, advertising platforms, and other sources |
|
Employee training |
Time spent learning the platform |
|
Reporting maintenance |
Ongoing work required to check and manage data |
|
Additional usage |
Charges for extra users, reports, or data volume |
For instance, the monthly charge of $40 for a reporting tool might initially seem very attractive.
Nevertheless, if the person keeps spending eight hours per month creating spreadsheets and analyzing the data, the actual cost of operation will be even higher.
Another software might charge more for its subscription but save some time by reducing the need for manual labor. It is not about which solution is better, but rather about the cost and benefits involved.
Think about a dashboard that displays revenues, orders, and advertising costs.
This information is valuable; however, who makes sense out of it?
When the founder has to go through many reports, do comparisons, and analyze each anomaly, a significant part of the analysis process is still done manually. Reporting software based on AI can simplify the process by providing summaries, finding trends, and highlighting important things that need to be addressed. What really matters here is whether such functionality solves an existing problem. It would not be wise to pay for unused features.
Founders usually know exactly how much money they have spent on software subscriptions.
But fewer are able to calculate the cost to their business of manual reporting, delayed information, and lack of warnings.
Such expenses are not always recorded in financial statements as separate entries but can affect profitability nonetheless.
Imagine starting every morning with the same routine.
We log into Shopify to check sales and orders and then proceed to log into Meta Ads to evaluate ad campaign performance.
After that, we proceed to log into Google Ads and then Google Analytics 4 in order to see website traffic and conversion rates.
Finally, we compile the report in Excel.
At the point of finishing this job, we have wasted considerable time generating the report, instead of using it for something else.
In case such work takes five hours each week, we will spend about 20 hours in 4 weeks or 240 hours in 48 weeks.
If we multiply this time by its hourly rate of $20 per hour, we get an annual cost of $4,800 in labor capacity.
Clearly, this is just a sample set of numbers, because there are no guarantees that the time saved will decrease salaries but will provide capacity for something else.
This is the practical value of reducing ecommerce reporting time through automation.
Assume that the D2C brand is spending $300 each day on advertising costs.
The same campaign that was successful in the previous week becomes less effective in terms of conversions. The cost per acquisition rises, but there is no immediate notice on that.
The campaign keeps running until the time of the next performance review. In case the problem is discovered in advance, the reason for it will be investigated and decisions will be made to make certain changes such as targeting, creative assets, landing page, or budgeting.
An AI-driven analytics tool with anomaly detection capability can assist in discovering the abnormal changes before the next review period.
But it will be only an initial step since it will not mean anything on its own and will not necessarily justify the need for campaign cessation and loss prevention.
That’s why real-time ecommerce analytics and alerts are most valuable when paired with informed human decisions.
Revenue growth is certainly encouraging but revenue does not tell the whole story.
A brand could be making $50,000 per month in revenue but spending a lot on marketing, discounts, shipping, returns, and fulfillment.
If costs are growing at a faster rate than revenue, a company can become less profitable despite having increasing revenue.
Revenue and order analysis fail to capture these trends. What is needed is a more advanced analytics system that measures CAC (customer acquisition cost), AOV (average order value), LTV (customer lifetime value), ROAS (return on ad spend), and contribution margin.
Finding the profit leaks in ecommerce helps brands determine where growth will put pressure on their finances.
AI adoption is no longer restricted to organisations with large technology budgets.
Cloud-based software and ready-made AI products have made many capabilities accessible without requiring businesses to develop their own machine learning models.
Research suggests that small businesses are increasingly experimenting with the technology, although adoption remains uneven.
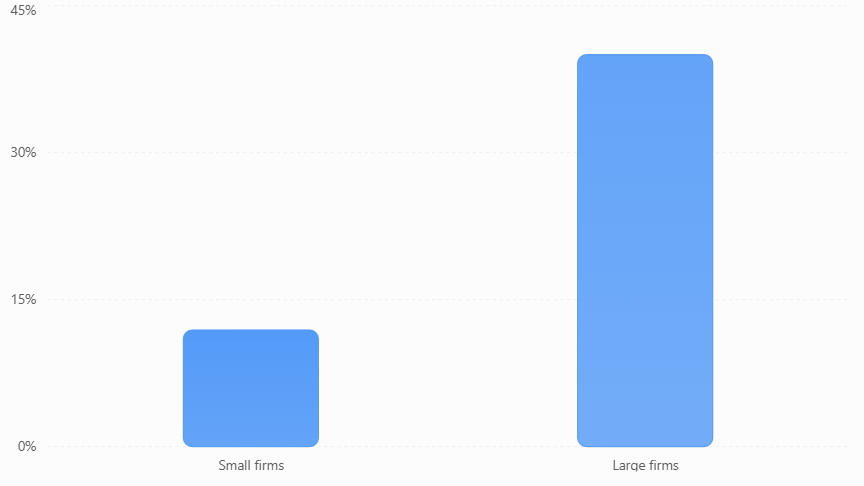
According to the OECD’s 2025 research on AI adoption among small and medium-sized enterprises, approximately 11.9% of small firms used AI, compared with 40% of large firms, based on 2024 or the latest available data.
The figures cover AI use more broadly rather than AI analytics specifically, but they highlight the gap between business sizes.
|
Business category |
AI adoption |
|
Small firms |
11.9% |
|
Large firms |
40% |
Source: OECD
Another perspective is offered through the U.S. Chamber of Commerce 2025 Small Business Technology Report, which has found that 58% of those who participated in its study were using generative AI, in contrast to 40% of firms in 2024.
It is important to stress that each of these studies focuses on different audiences and types of AI use, so percentage comparison cannot be done.
Overall, however, these results show an increasing trend of interest to AI from smaller companies, along with the demonstration that the adoption process still depends on certain things, such as cost, necessary skills, and utility.
For direct-to-consumer brands, this means using technology that streamlines processes.
The strengths of AI analytics become more apparent when they are connected to real-world business decisions.
A tool does not have value simply because it utilizes artificial intelligence; rather, it has to help a person comprehend a situation or make a better decision.
Consider a campaign that gives you a 4X return on your advertising spend.
This seems great on the surface.
Nevertheless, after considering all costs of product production, discounts, payment fees, and fulfillment, the campaign may bring in quite some income but may not provide you with decent margins.
AI-powered data analytics will be useful in helping your team arrange all information from various sources to evaluate your marketing efforts from a larger business perspective.
For example, looking at CAC alongside customer lifetime value can help founders understand whether acquisition spending makes financial sense over time.
A drop in sales does not always represent a problem.
Fluctuation is quite common, especially when there is low volume of orders.
Nevertheless, a sudden change in conversion rate, costs of advertisement or order value might require further investigation.
The use of AI-based analytics can help detect any irregularities based on previous trends and set limits.
It is not necessary to analyze reports all the time.
Inventory locks up working capital, making it imperative that predictions be made in order to facilitate the growth of D2C brands.
Over-ordering may end up increasing the cost of storage and even cause unsold inventory, whereas under-ordering may cause stockouts in times of high demand.
Predictive analysis tools may help predict future demand by analyzing past sales, purchase patterns, and other input variables.
However, these forecasts are not foolproof, especially when it comes to new stores with little history.
Nonetheless, they can help make better-informed decisions.
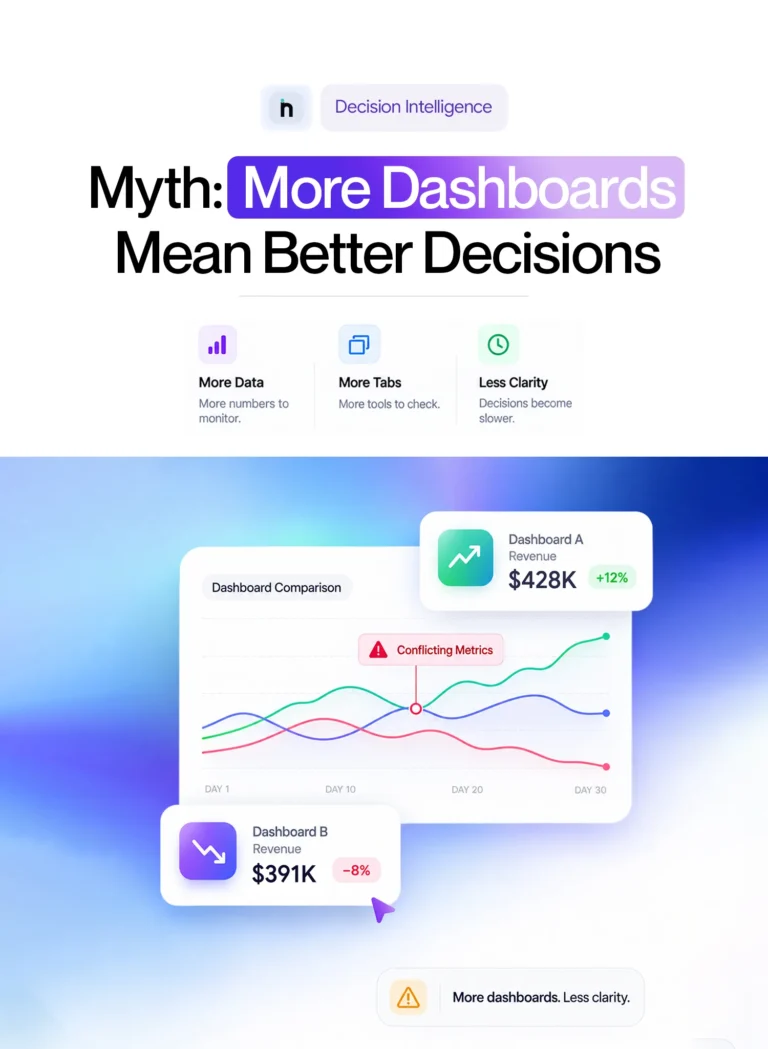
More dashboards do not necessarily mean better clarity.
When a founder sees dozens of KPIs every morning, deciding where to focus can become another task.
While revenue could be growing, the ROAS may be falling; traffic could be growing without any growth in conversions. Without the context, every number brings up more questions.
The challenge with too many dashboards in business intelligence is that organizations can spend more time analyzing the reports rather than taking action on them.
Artificial intelligence in business intelligence can help by highlighting relevant signals and metrics.
All growing brands don’t have the resources to appoint data analysts on a full-time basis.
Even when someone handles reporting internally, they may lack the time to investigate every performance change.
AI-based analytics for Small Businesses could help certain analytical activities become easier using automatic summaries, Q&A in natural language, and pattern finding.
AI cannot replace experience nor does it fix issues of bad data quality.
But it could enable smaller groups to work with data that was scattered around otherwise
Understanding the cost of analytics software is only half the equation.
You also need to understand the value it could create.
Return on investment, or ROI, provides a simple way to compare measurable benefits against total costs.
Now let’s imagine an expanding ecommerce brand analyzing a potential new analytics platform.
The brand currently spends several hours each month on manual reporting. It also wants earlier visibility into changes in advertising performance.
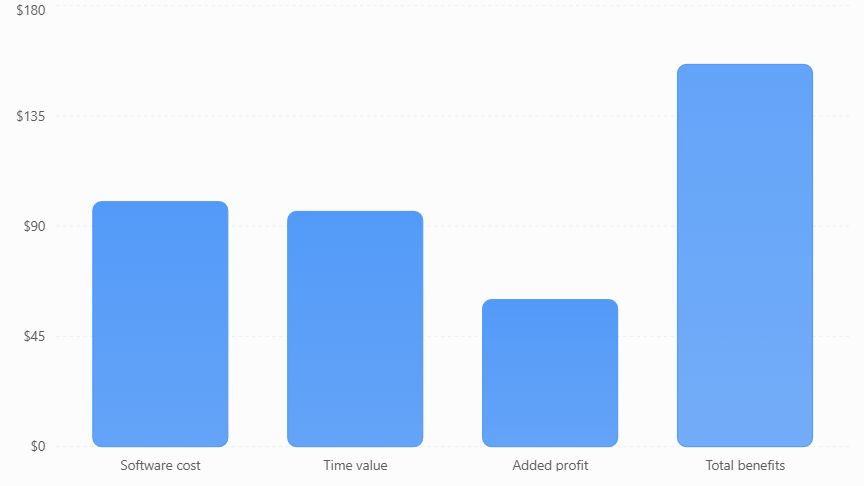
Here’s a hypothetical monthly calculation:
|
Monthly cost or benefit |
Amount |
|
Analytics software and related costs |
$100 |
|
Reporting time saved: 12 hours at $8/hour |
$96 |
|
Additional contribution profit from an improved marketing decision |
$60 |
|
Total measurable monthly benefits |
$156 |
|
Net monthly benefit |
$56 |
This is an illustrative example, not actual Netsights pricing or a verified customer result.
The basic formula is:
AI Analytics ROI (%) = [(Total Measurable Benefits − Total Costs) ÷ Total Costs] × 100
Using these figures:
ROI = [($156 − $100) ÷ $100] × 100 = 56%
In this example, the estimated monthly return is positive.
But there are important conditions.
The time savings need to be genuine, and the business must use that time productively. Any additional contribution profit should also be supported by evidence rather than assumed.
A break-even point is achieved when the calculated monthly benefit equals the total monthly cost.
For example, if the monthly cost of analytics is $100, and the firm is able to save or generate $100 in contribution value per month, then the firm has achieved the break-even point.
If anything above this happens, there is likely going to be a profit.
However, firms need to factor in the time taken to integrate the tool into their business processes.
A more practical approach for evaluating ROI of AI analytics is by using real results over several months of usage.
Looking for the optimal AI analytics solutions can very quickly become intimidating.
Some solutions concentrate on reporting. Some will give you predictive analytics, customer segmentation, anomaly detection, or conversational interfaces.
The longest feature list may not always be the best one.
Choosing the correct solution as a small D2C brand should begin with identifying what problems to solve.
Before comparing platforms, jot down three questions that your team cannot seem to answer easily.
For example:
Check if this software is able to provide answers based on information available to you currently.
A platform that addresses real business challenges is more useful than one filled with advanced features your team rarely touches.
The accuracy of AI-powered analytics depends on the quality of the data it receives.
Incomplete tracking or inconsistent definitions of revenue in various systems can result in incorrect analysis.
Make sure you understand what platforms can be integrated, how often data is refreshed, and if the figures correspond to your trusted source systems.
The NIST AI Risk Management Framework also provides useful principles for assessing AI reliability, transparency, security, and risk.
Even the most powerful analysis tools will be almost useless if no one is using them.
The interface should be intuitive for your team, with clear, easy-to-understand reports that don’t require advanced technical knowledge.
It’s also worth considering whether automated summaries and alerts fit naturally into existing workflows.
A notification system may be more helpful for the founder, who likes short morning briefs, than yet another dashboard to be visited daily.
One challenge many D2C founders face isn’t a lack of data.
The problem is having too much data without having a clear idea of what to pay attention to.
Netsights is built around that problem.
Instead of considering reporting as the end point, the platform concentrates on making it easier for ecommerce teams to make their performance data into business insights.
The Netsights ecosystem consists of tools for change analysis, alert generation, and business performance questioning.
iSight AI is Netsights’ AI-enabled revenue intelligence platform.
It is designed to examine store performance, advertising activity, and customer data to identify anomalies, analyse possible causes, support forecasting, and recommend actions.
For instance, when ROAS falls down and advertising budget rises, iSight may draw attention to that connection.
The aim is to make analysis easier rather than forcing founders to analyze each metric on their own.
Netification enables automated reports and KPI alerts via WhatsApp, Slack, or emails.
Rather than navigating through multiple dashboards to comprehend the previous day’s performance, teams can receive relevant notifications via mediums they already use.
This includes daily reports and alert notifications when certain KPIs exceed set thresholds.
For a founder managing several responsibilities, that can make regular performance monitoring easier to maintain.
Netty gives conversational access to business insights via WhatsApp.
Instead of having to look at different graphs, people can just ask simple questions about revenue, ROAS, or any other aspect of performance.
This makes it easier for entrepreneurs who want their answers without having to set up their reports.
These all sum up the transition from reporting to more user-friendly decision-making.
The difference between regular e-commerce dashboards and the Scaleboard by Netsights is relevant for those who are trying to save time analyzing data.
Actual affordability will depend on current plan pricing, required integrations, and the value a business gets from using the platform.
Not every business needs paid AI analytics from day one.
If your store handles a small number of orders and advertising activity is limited, existing reports and spreadsheets may be enough.
The need becomes more apparent as operations grow.
You might consider investing when your team regularly spends hours preparing reports, struggles to compare marketing channels, or notices important performance changes too late.
Another sign is when decisions become harder despite having more data.
You don’t need to automate every reporting process immediately.
Begin by selecting a specific issue, for instance, the need to shorten the reporting process or need to increase visibility on the acquisition costs.
Select some KPIs, ensure that the data is correct and measure the process both before and after implementing the software.
Track the results over a consistent period.
The 10-point ecommerce data analytics checklist will assist you to determine the data and reporting processes that should be prioritized.
In case the software helps you save time or makes better decisions, it would make sense to roll out its implementation further.
If it doesn’t, reconsider the setup or whether your business needs that level of analytics yet.
The assumption that all AI-driven analytics software solutions are too expensive for small D2C brands is becoming obsolete.
Enterprise-level solutions might still cost a fortune, but subscription-based software has opened up more possibilities for smaller companies.
This does not mean that all software solutions are worth the money.
The wisest choice is the one that addresses a real need, fits your budget, and provides tangible value.
In case of a growing D2C brand, good analytics can mean saving time on report preparation, quicker identification of shifts in performance, and greater confidence in decision-making.
The aim is not to gather more information. The aim is to leverage the information you already have.
If it becomes hard for you to generate reports from different platforms, start with Netsights and see if AI-driven insights work for you.
A: Yes, many AI analytics tools offer subscription plans suitable for small businesses. Compare pricing, features, and potential time savings to find a solution that fits your budget
A: AI analytics helps D2C brands automate reports, track marketing performance, detect unusual trends, and make informed decisions using business data
A: Traditional dashboards display business metrics, while AI analytics tools can identify patterns, detect anomalies, generate insights, and support forecasting
A: Calculate the value of time saved and measurable business improvements, subtract total software costs, and divide by those costs. Track actual results to assess ROI accurately
A: Look for relevant integrations, accurate reporting, automated alerts, transparent pricing, and an easy-to-use interface that supports your business goals
A: Consider upgrading when manual reporting takes too much time, data becomes difficult to manage, or delayed insights affect important business decisions
We write about growth, retention, and the numbers that actually predict what happens next for D2C brands. Have a topic you'd like us to cover? Get in touch .
Your ecommerce store already contains the answers. Learn how AI ecommerce analytics helps founders ask business questions, understand what changed and why, and move from scattered data to clearer decisions.
Your ecommerce store already contains the answers. Learn how AI ecommerce analytics helps founders ask business questions, understand what changed and why, and move from scattered data to clearer decisions.
Your ecommerce store already contains the answers. Learn how AI ecommerce analytics helps founders ask business questions, understand what changed and why, and move from scattered data to clearer decisions.