
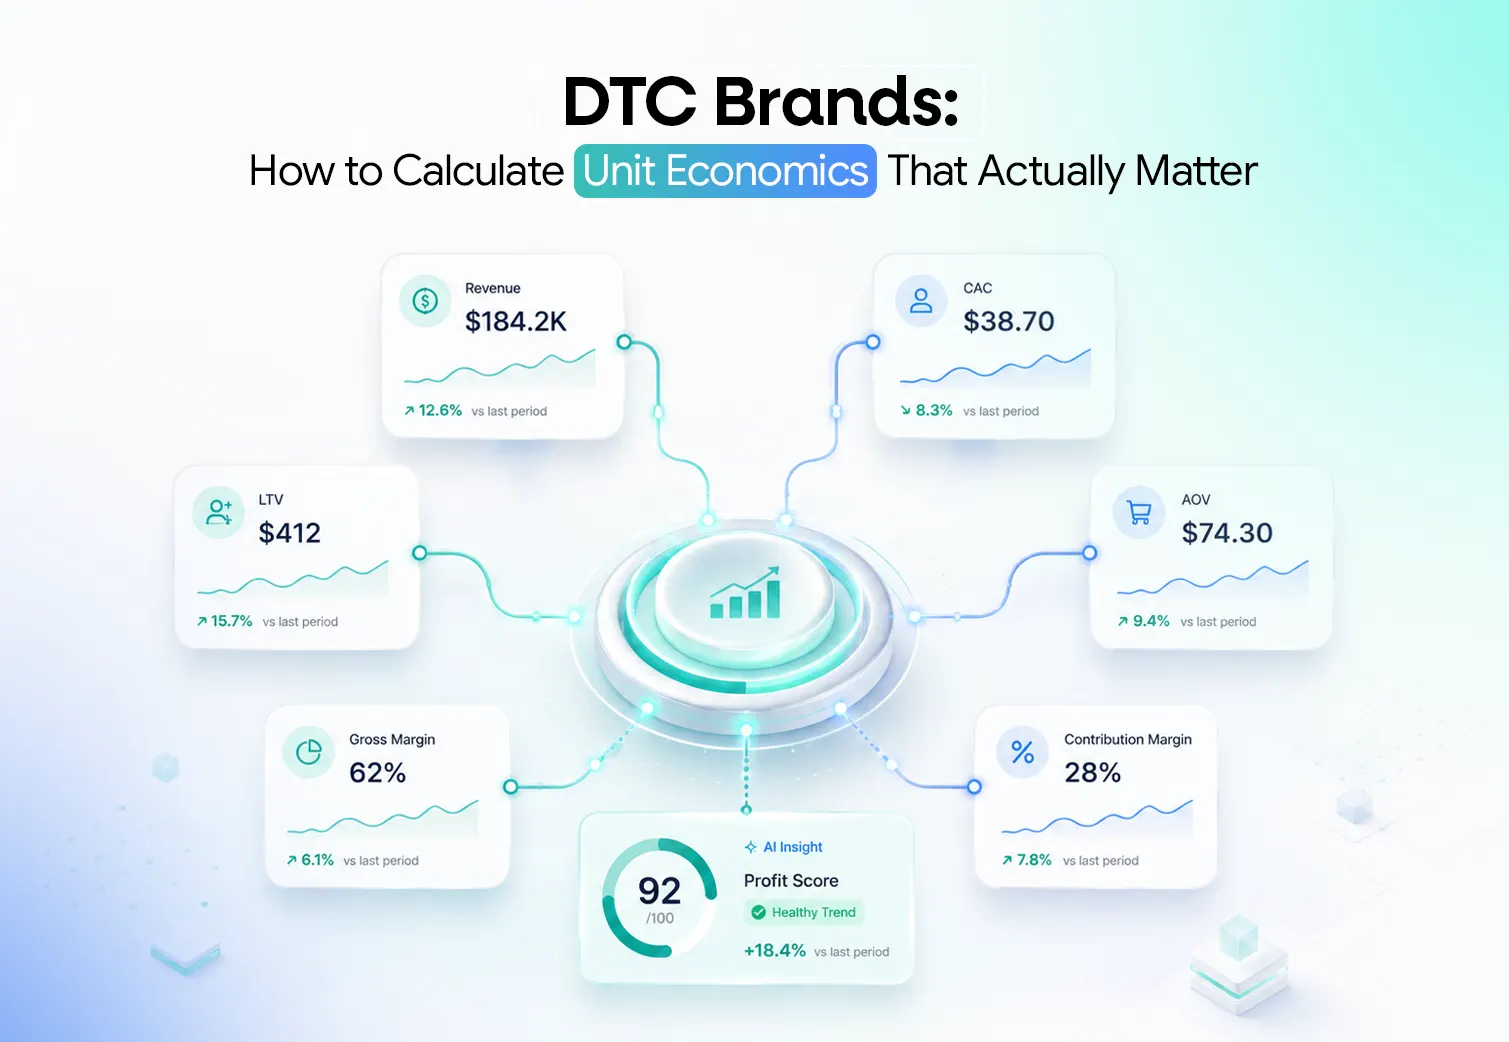
Revenue is growing. Shopify shows more orders, Meta Ads reports a healthy ROAS, and average order value is moving in the right direction.
From the outside, the business appears to be scaling.
Behind those headline metrics, however, cash flow may remain tight. Profitability fluctuates from month to month, inventory absorbs more working capital, and each increase in advertising spend creates additional pressure across fulfilment, customer support and operations.
That disconnect usually appears when DTC brands measure sales growth without calculating the economics behind each sale.
Revenue tells you how much customers spent. ROAS compares attributed revenue with advertising investment. Neither figure reveals how much value remains after discounts, product costs, fulfilment, shipping, payment fees, returns and customer acquisition.
DTC unit economics show whether every order and customer creates enough financial value to support sustainable growth.
Instead of asking only, “How much did we sell?”, ecommerce founders need to ask:
How much value did the business retain after acquiring the customer and delivering the order?
Answering that question helps DTC brands decide which products to promote, how much they can afford to spend on acquisition, whether discounts are sustainable and how quickly marketing investment returns as cash.
DTC unit economics measures the revenue, variable costs and contribution generated by a specific unit of an ecommerce business. Depending on the decision being made, the unit may be an order, product, customer, acquisition channel or customer cohort.
Order-level economics reveal whether a transaction remains profitable after product, packaging, shipping and fulfilment expenses. Customer-level economics compares the total value created by a buyer with the cost of acquiring and retaining them.
Cohort-level analysis provides an even sharper view by grouping customers according to acquisition month, campaign, channel, first product, geography or discount used. Comparing those groups helps founders identify where profitable growth is genuinely coming from.
Blended CAC, for example, may appear healthy even when one channel attracts profitable repeat buyers and another brings in promotion-led customers who never return.
No single metric provides the entire answer. Useful ecommerce unit economics connect order margin, customer acquisition cost, lifetime value, repeat behaviour and payback period to show how efficiently revenue becomes profit.
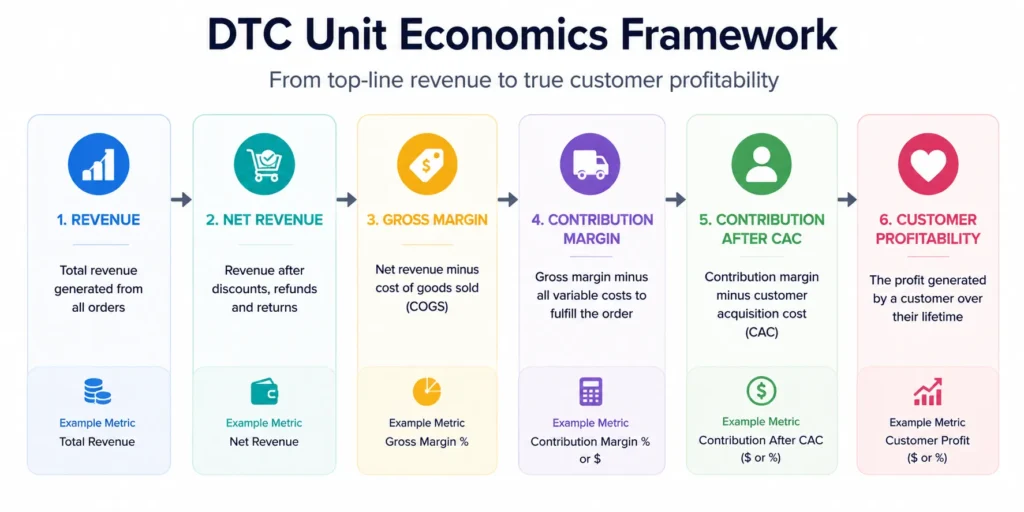
Strong revenue growth can coexist with weak profitability.
Consider a DTC brand generating $100,000 in monthly sales at a reported 4x ROAS. Paid acquisition appears efficient because the business is generating four dollars of attributed revenue for every dollar of advertising spend.
Once product costs, discounts, packaging, shipping, fulfilment, transaction fees and returns are deducted, the remaining contribution may be much smaller than expected.
ROAS creates this blind spot because it measures advertising efficiency rather than business profitability. Meta Ads does not deduct the cost of manufacturing the product, Shopify fulfilment fees, shipping subsidies or refunds when reporting campaign revenue.
Advertising platforms also apply different attribution rules. Meta Ads, Google Ads, Shopify and Google Analytics can therefore report different revenue totals for the same period.
Each tool offers useful information, but none provides a complete profitability view on its own.
Brands should evaluate advertising results through a wider ROAS optimisation checklist and reconcile platform-reported sales with actual store revenue, customer data and contribution margins.
Without that connection, teams frequently know that performance changed without understanding what caused the movement. Disconnected reports eventually create conflicting interpretations, data overload and slower decisions. Learning how to stop drowning in data and start making decisions becomes more important as the business expands.
See what revenue and ROAS are not telling you. Connect Shopify, Meta Ads, Google Ads and customer data to understand what is actually driving profit
Reliable unit economics start with the revenue the company actually retains.
Gross sales can overstate performance because they may include discounts, cancelled orders, refunds and products that are later returned.
Net revenue is more useful:
Net revenue = Gross sales − Discounts − Refunds − Returns
Imagine a product listed at $100 but regularly sold with a 15% discount. Using the $100 list price would immediately overstate average order value, gross margin and customer lifetime value.
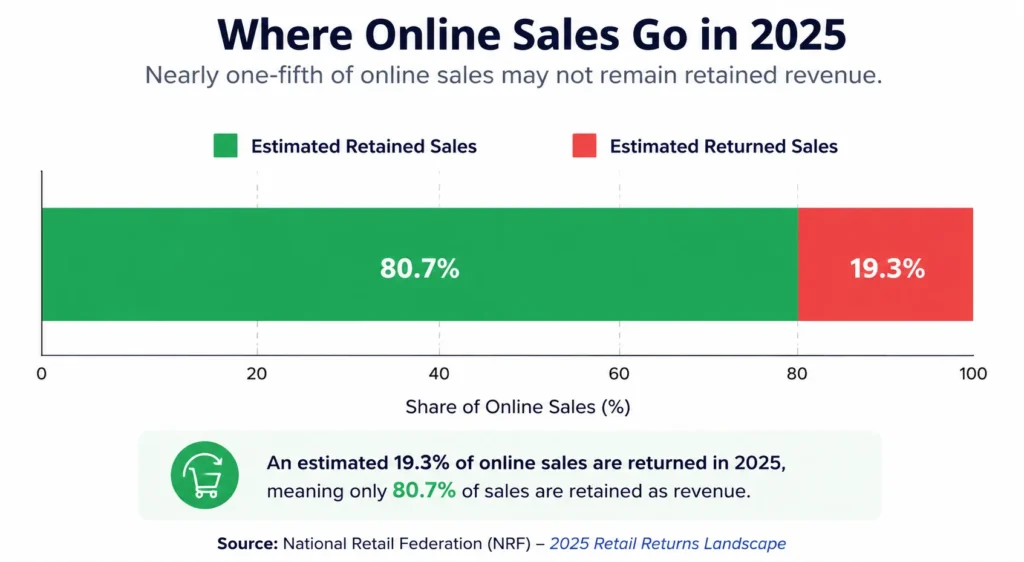
Returns create an even larger risk.
According to the National Retail Federation’s 2025 Retail Returns Landscape, an estimated 19.3% of online sales were expected to be returned during 2025. The research also found that 82% of consumers considered free returns important when shopping online.
Return rates vary substantially across product categories, but the finding demonstrates why ecommerce brands cannot assume every fulfilled order will remain recognised revenue.
Apparel, footwear and fit-sensitive products may face higher exposure than categories with predictable replenishment behaviour. In either case, expected return costs should be reflected in product, order and customer-level profitability.
Gross margin measures how much net revenue remains after deducting the cost of goods sold.
Suppose an order generates $80 in net revenue and the product costs $28 to manufacture. Gross margin per order would be $52.
Although useful, that figure may exclude several expenses required to process and deliver the sale.
Contribution margin offers a more realistic view by deducting the broader variable costs associated with the order.
For a typical DTC brand, those expenses may include manufacturing, packaging, fulfilment, shipping subsidies, payment processing, variable transaction fees and expected return costs.
Using the same $80 order, assume the following expenses:
| Cost component | Amount |
| Cost of goods sold | $28 |
| Packaging | $2 |
| Fulfilment | $4 |
| Shipping subsidy | $6 |
| Payment processing | $2 |
| Expected return cost | $3 |
| Total variable costs | $45 |
| Contribution margin | $35 |
After accounting for variable expenses, only $35 remains to recover customer acquisition cost, contribute towards fixed operating expenses and eventually generate profit.
Contribution margin percentage makes the result easier to compare across products and order values. In this example, $35 divided by $80 produces a contribution margin of 43.75%.
Financial definitions can vary between companies. Shipping may be treated differently by a brand that charges customers the full delivery cost, while support expenses may be included only when they vary directly with order volume.
Consistency matters more than complexity. When one report includes shipping and another excludes it, month-to-month comparisons become misleading even if both calculations appear correct.
Customer acquisition cost measures how much a business spends to gain one new customer.
Shopify defines CAC by adding the expenses associated with acquiring customers during a given period and dividing that total by the number of new customers acquired. Its enterprise guidance also recommends considering both direct and indirect acquisition costs when assessing the true cost of customer growth.
The calculation itself is simple. Choosing which costs to include is more difficult.
Platform CAC may count only Meta Ads spend. Paid CAC can combine media investment across Meta, Google and other paid channels. Blended CAC generally compares broader acquisition spending with all newly acquired customers, including organic buyers.
Fully loaded CAC can include media, creative production, agency support, influencer fees, affiliate commissions, acquisition technology and relevant team costs.
Assume a brand spends $30,000 on advertising, $4,000 on creative and $3,000 on agency support while acquiring 1,000 new customers.
Media-only CAC appears to be $30. Including the additional acquisition expenses, fully loaded CAC to $37.
Seven dollars may seem minor at individual-customer level. Across 10,000 newly acquired buyers, however, the difference represents $70,000 in acquisition costs that a platform-only calculation would overlook.
A more detailed comparison of CAC and LTV for D2C brand profitability can help teams avoid combining incompatible cost definitions.
Stop relying on incomplete CAC calculations. Bring acquisition, store and customer data together to evaluate the true cost of growth
The LTV-to-CAC ratio compares customer value with customer acquisition cost.
When contribution-based LTV is $140 and fully loaded CAC is $35, the result is 4:1.
Shopify’s January 2026 guidance describes 3:1 as a commonly referenced LTV-to-CAC “sweet spot”, representing three dollars of lifetime value for every dollar spent on acquisition.
That benchmark provides context, not a universal target.
A brand with high margins and fast repeat purchases may operate comfortably at a lower ratio. Another company may require a larger margin of safety because of seasonal demand, inventory commitments, high return exposure or slow customer payback.
Definitions must match as well. Comparing revenue-based LTV with fully loaded CAC produces a different conclusion from comparing contribution-based LTV with media-only CAC.
Founders should therefore evaluate the ratio alongside contribution margin, customer payback and cash requirements rather than treating 3:1 as an automatic pass or fail.
A data-driven growth strategy is a structured approach that uses connected business data to identify meaningful performance changes, diagnose their likely causes, estimate their commercial impact and prioritise the actions most likely to improve growth.
This process involves more than tracking KPIs. It connects reporting with reasoning and reasoning with action.
Data collection tells the business what information is available. Reporting organises that information. Analytics identifies patterns. Diagnostic analysis investigates why those patterns occurred. Decision intelligence evaluates what the findings mean for the business and what should happen next.
Most ecommerce companies invest heavily in data collection and reporting. They install more tracking tools, build larger dashboards and automate weekly reports. However, the responsibility for interpretation remains manual.
The founder or Growth Head must still decide which metric matters, whether the change is significant, what caused it and which team should respond.
That unresolved work is the insight-to-action gap.
Businesses experiencing this problem do not necessarily need another report. They need a system that helps them stop drowning in data and start making decisions.
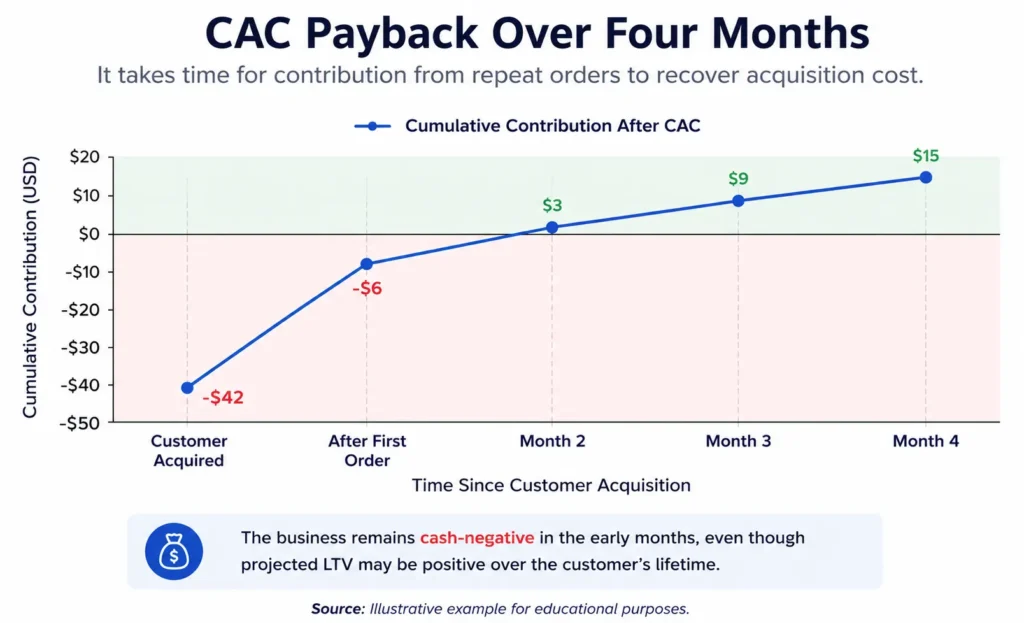
Lifetime value estimates what a customer may eventually be worth. CAC payback shows how quickly the company recovers the money spent to acquire them.
Timing is particularly important for inventory-led DTC brands.
Assume CAC is $36 and the average customer generates $12 in monthly contribution profit. Recovering the acquisition cost takes approximately three months.
Fast payback gives the business more flexibility to reinvest in inventory and marketing. Slow recovery places greater pressure on working capital, even when the customer is expected to become profitable eventually.
Brands relying heavily on future repeat orders should monitor the customer acquisition cost payback period instead of using lifetime profitability as their only acquisition guardrail.
First-order profitability compares the contribution generated by a customer’s initial order with the cost of acquiring that buyer.
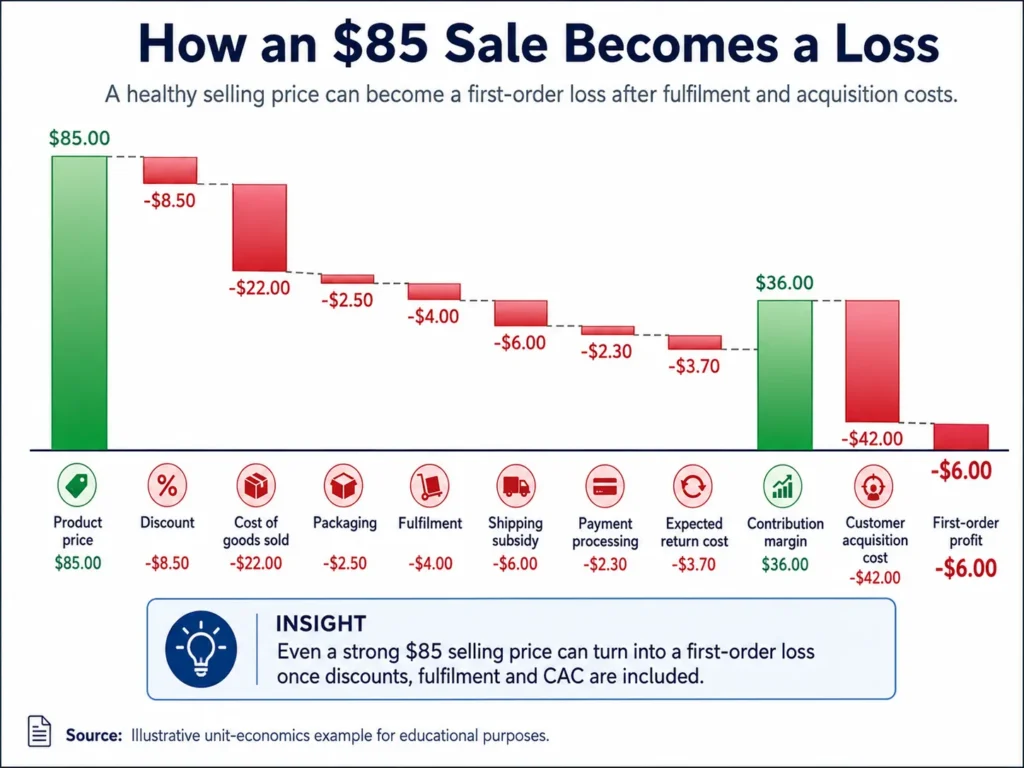
Suppose first-order contribution is $36 while fully loaded CAC is $42. The business loses $6 on the initial transaction.
Such a loss is not automatically unsustainable. A later purchase may generate enough contribution to recover the shortfall.
Risk increases when the model depends on repeat behaviour that has not been validated. Lower-than-expected retention, deeper discounts or a rise in shipping cost can prevent the predicted profit from materialising.
Break-even CAC establishes a practical spending limit. On a first-order basis, it broadly equals the contribution margin generated by the initial purchase. When first-order contribution is $36, spending more than $36 to acquire the customer produces an immediate loss.
Lifetime break-even CAC may be higher, but it should be built on verified cohort behaviour rather than optimistic retention targets.
Consider a fictional skincare brand selling through Shopify and acquiring customers through Meta Ads.
Its product is listed at $85 and sold with a 10% introductory discount, creating $76.50 in net revenue.
Manufacturing costs $22. Packaging, fulfilment, shipping, payment processing and expected return costs add another $18.50. After deducting $40.50 in variable expenses, first-order contribution is $36.
Fully loaded CAC is $42, leaving a first-order loss of $6.
Now assume that 40% of new customers place a second order and each repeat order creates $38 in contribution margin.
Expected second-order contribution per newly acquired customer is $15.20 because only 40% of the cohort is expected to return. Across the first two orders, expected contribution reaches $51.20.
Compared with a $42 CAC, the customer becomes contribution-positive, although only $9.20 remains before fixed operating expenses.
Metric | Result |
Listed price | $85.00 |
Net revenue after discount | $76.50 |
Total variable costs | $40.50 |
First-order contribution | $36.00 |
Fully loaded CAC | $42.00 |
First-order profit | -$6.00 |
Expected repeat contribution | $15.20 |
Expected contribution after two orders | $51.20 |
Contribution remaining after CAC | $9.20 |
A relatively small movement can change the outcome. Increasing CAC from $42 to $48 reduces the remaining contribution to $3.20. Higher shipping or refund costs could eliminate it completely. Improved retention or stronger product margins would move the result in the opposite direction.
Know where every order gains or loses value. Track contribution margin, acquisition cost and customer profitability in one connected view
Blended averages frequently conceal meaningful differences between customer groups.
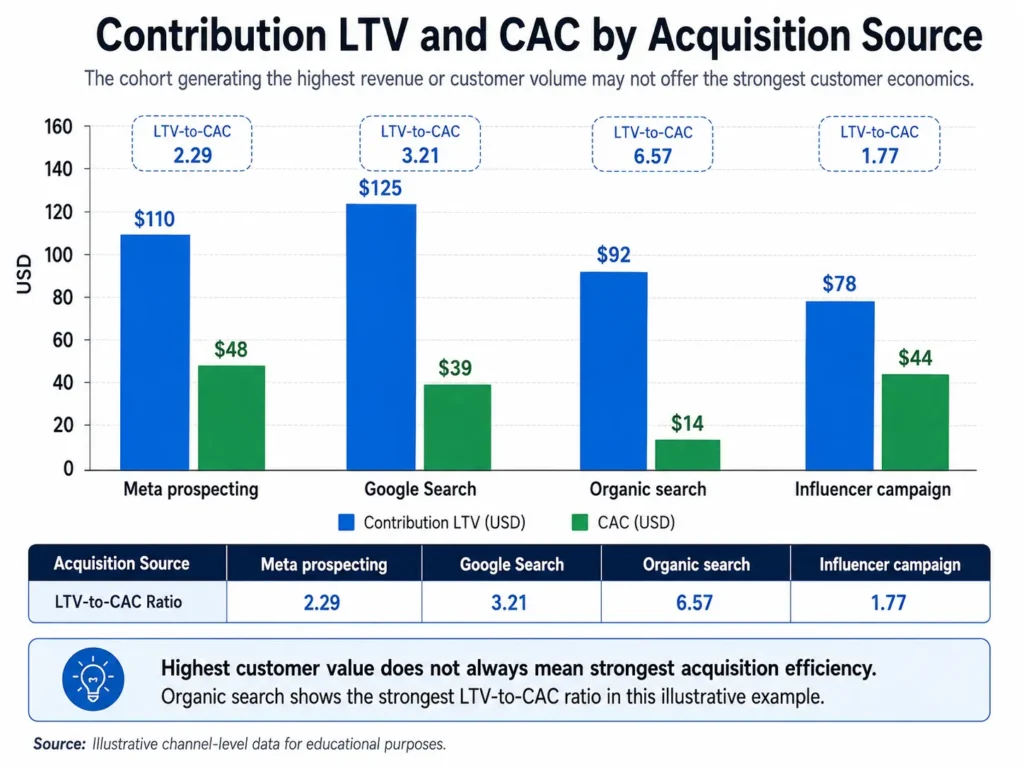
A brand may report an average CAC of $35 and average LTV of $120. Behind those numbers could be low-cost organic customers, expensive Meta buyers, promotion-led shoppers with poor retention and subscription customers with stronger recurring value.
Cohort analysis separates those groups and evaluates how their economics develop over time.
Klaviyo explains that cohort analysis groups customers according to shared characteristics, such as when or how they converted, so businesses can identify patterns in repeat purchasing and retention.
For DTC brands, useful cohorts may be based on acquisition month, channel, campaign, first product, geography or discount level.
Once those segments become visible, founders can identify which products attract valuable repeat customers, whether promotion-driven buyers return without additional discounts and which channels recover CAC fastest.
Research on CLV modelling supports the same principle: customers rarely have identical purchasing patterns or economic value. Treating everyone as an average customer can therefore distort acquisition and retention decisions.
Customer retention can reduce reliance on continuous paid acquisition, but repeat revenue should not automatically be treated as profitable revenue.
Klaviyo defines repeat purchase rate as the percentage of customers who have purchased more than once and describes 20% to 30% as a commonly healthy range. Its guidance also makes clear that performance depends on the category, product lifecycle and business model.
A replenishable beauty or food product naturally offers different repeat-purchase opportunities from furniture or high-value electronics.
Profitability matters just as much as frequency. A repeat purchase may create limited contributions when it depends on a heavy discount, free shipping and high communication costs.
Retention performance should therefore be measured through repeat-order contribution rather than repeat revenue alone.
A Klaviyo case study of apparel brand Heist Studios reported a 44% repeat purchase rate, with its customer community contributing 20% of sales. As a vendor-published case study, those figures illustrate what was possible for that specific brand rather than providing a universal DTC benchmark.
Comparing customer retention versus acquisition through margin, payback and cohort behaviour helps brands decide where further investment is most likely to create sustainable value.
Academic research supports the idea that customers should be evaluated through long-term economic contribution rather than immediate transactions alone.
The 2024 study by Nafez Ali and Osama Samih Shabn examined the relationship between CLV, strategic marketing and organisational financial performance. Its 332 valid survey responses provided evidence that customer-value insights can contribute to marketing and financial decision-making, although the mixed-methods design and participant context mean the results should not be applied as a fixed ecommerce benchmark.
A 2024 systematic literature review on AI and customer lifetime value management similarly describes CLV as a tool for allocating resources and tailoring marketing towards profitable customer relationships. The review also highlights how risk factors and modelling choices affect the reliability of customer-value estimates.
Machine-learning research adds another layer of caution. OptDist, published in 2024, argues that CLV data is difficult to model because it often contains large numbers of low-value customers alongside a much smaller group whose spending is several orders of magnitude higher. Such long-tailed behaviour explains why a single average LTV can misrepresent the economics of real customer segments.
Together, these studies support three practical lessons for DTC brands: calculate value using contribution rather than revenue alone, evaluate customers through cohorts and treat future LTV as an estimate that should be updated as behaviour develops.
Revenue-based LTV is often presented as if it were profit. Platform CAC is treated as the full cost of acquiring a customer. Returns are excluded until month-end, while gross sales are used instead of retained revenue.
Inconsistent financial definitions create another problem. When fulfillment appears in one contribution-margin report but disappears from the next, an apparent improvement may be caused by accounting changes rather than better performance.
Optimising individual metrics in isolation can be equally misleading.
Higher AOV may result from a heavily discounted bundle. Improved conversion can coincide with a rising return rate. Lower CAC may come from customers who never purchase again. Stronger ROAS may still produce declining contribution profit.
For that reason, every growth metric needs a balancing financial measure.
Growth metric | Review alongside |
Revenue | Contribution profit |
ROAS | Contribution after marketing |
AOV | Contribution margin per order |
CAC | Margin-based LTV and payback |
Conversion rate | Refund and return rate |
Repeat purchase rate | Repeat-order contribution |
Improving ecommerce unit economics does not always require reducing advertising investment.
Often, the stronger opportunity lies in improving the relationship between acquisition cost, product margin, retention and cash recovery.
Product mix deserves careful attention. A high-revenue SKU may contribute less profit than a lower-priced item with stronger margins, cheaper shipping and fewer returns.
Discounting should be evaluated beyond conversion rate. Brands need to determine whether promotion-acquired customers return at full price and whether additional order volume offsets the reduction in margin.
Shipping thresholds, bundles and upsells can increase AOV, but each tactic should be assessed against fulfillment cost and contribution per order. Better product descriptions, sizing guidance, quality control and post-purchase communication may protect profitability by reducing preventable returns.
Retention works best when communication reflects customer behaviour, replenishment cycles and previous purchases rather than relying on blanket promotions.
Connecting pricing, acquisition, retention and operational data through a broader data-driven growth strategy allows the business to optimise the full system rather than improving one dashboard number at the expense of another.
Traditional ecommerce dashboards are designed to report what happened.
They display revenue, orders, ROAS, CAC and conversion rate. Teams may still need to open several platforms, reconcile conflicting figures and manually investigate why performance changed.
A Scaleboard takes a more decision-focused approach by connecting store, marketing and customer performance. The distinction between traditional ecommerce dashboards and Scaleboards lies in moving from isolated reporting towards interpretation and action.
Netsights.ai brings together ecommerce and advertising data from platforms such as Shopify, Meta Ads, Google Ads and Google Analytics.
Within the platform, iSight helps teams identify anomalies, investigate possible root causes, forecast revenue and surface recommended actions. Netification provides alerts when significant metrics change, allowing businesses to respond to rising CAC, refund spikes or revenue anomalies sooner. Through Netty, founders and growth teams can ask questions about business performance without manually interpreting multiple reports.
Decision intelligence does not replace a clearly defined unit-economics model. It makes that model easier to monitor, interpret and use.
Stop measuring growth without measuring profit. Connect customer, marketing and store performance to understand which products, channels and cohorts are creating sustainable value
Healthy DTC unit economics are not defined by the metrics that look most impressive on a dashboard.
What matters is the value remaining after a customer has been acquired and their order has been delivered.
Contribution margin, fully loaded CAC, margin-adjusted LTV, first-order profitability and CAC payback provide a more realistic picture than revenue or ROAS viewed alone.
Cohort analysis makes that picture even clearer by showing which products, channels and customer groups create sustainable contributions over time.
That shift reflects the purpose of ecommerce decision intelligence moving beyond what happened to understand why it happened, what it means for profitability and which action should follow.
A: DTC unit economics measures the revenue, variable costs and contribution associated with an order, product or customer. They help brands understand whether acquisition, fulfilment and retention generate enough value to support profitable growth.
A: Add the relevant acquisition expenses for a defined period and divide the total by the number of new customers acquired. Depending on the chosen definition, costs may include paid media, creative, agency, affiliate, technology and acquisition-team expenses.
A: Gross margin usually deducts the cost of goods sold from net revenue. Contribution margin accounts for a wider range of variable expenses, including packaging, fulfilment, shipping, transaction fees and expected return costs.
A: Margin-based LTV is generally more useful for acquisition and profitability decisions because it estimates the value retained after relevant costs. Revenue-based LTV may support sales forecasting, but it should not be treated as customer profit.
A: No. Although 3:1 is a commonly cited benchmark, its suitability depends on contribution margin, payback speed, cash availability, return rates and retention predictability. LTV and CAC must also use compatible definitions.
A: ROAS compares attributed revenue with advertising spend but excludes product costs, fulfilment, shipping, discounts, payment fees and refunds. Once those expenses are included, a campaign with strong ROAS may generate limited contribution profit.
A: Returns reduce net revenue and may create additional logistics, payment and inventory-processing costs. Excluding expected returns can overstate AOV, contribution margin, LTV and break-even CAC.
A: Most brands should review their core unit economics monthly while monitoring faster-moving indicators such as CAC, advertising efficiency, refunds and contribution margin weekly. Higher-volume businesses may require real-time alerts for material changes.
We write about growth, retention, and the numbers that actually predict what happens next for D2C brands. Have a topic you'd like us to cover? Get in touch .
Your ecommerce store already contains the answers. Learn how AI ecommerce analytics helps founders ask business questions, understand what changed and why, and move from scattered data to clearer decisions.
Your ecommerce store already contains the answers. Learn how AI ecommerce analytics helps founders ask business questions, understand what changed and why, and move from scattered data to clearer decisions.

Your ecommerce store already contains the answers. Learn how AI ecommerce analytics helps founders ask business questions, understand what changed and why, and move from scattered data to clearer decisions.