Introduction
For many ecommerce teams, Ecommerce Dashboards have become the default way to track business performance. They help founders monitor revenue, orders, ad spend, traffic, conversion rate, ROAS, CAC, customer behaviour, and product performance from different tools.
That visibility is useful. But visibility alone does not always help a founder make the right decision.
A traditional ecommerce dashboard may show that revenue dropped yesterday. Meta Ads may show that ROAS declined. Google Ads may show higher CPC. GA4 may show fewer sessions or lower engagement. Shopify may show fewer orders. But even after checking all of this, the founder is often left with a bigger question: what should the team fix first?
This is where the difference between traditional Ecommerce Dashboards and a Scaleboard becomes important.
A dashboard gives you performance data. A Scaleboard helps turn that data into a business direction.
This blog compares NetSights with traditional ecommerce dashboards from a practical founder’s perspective. Instead of only looking at features, we will look at how each approach supports reporting, diagnosis, decision-making, growth planning, and daily ecommerce operations.
Why Ecommerce Dashboards Became Important
Before discussing what a Scaleboard does differently, it is important to understand why ecommerce dashboards became popular in the first place.
Modern ecommerce businesses run on multiple systems. A Shopify or WooCommerce store tracks orders, revenue, products, collections, and customer activity. Meta Ads and Google Ads track paid media performance. GA4 tracks website and event behaviour. Klaviyo or CRM tools track email, WhatsApp, customer journeys, and repeat purchase behaviour. Logistics, payment, and finance tools add another layer of operational data.
Without dashboards, this information becomes difficult to manage.
Traditional Ecommerce Dashboards help solve the first big problem: visibility. They bring key numbers into one place so teams can see what is happening across the business.
For example, a dashboard may help an ecommerce team monitor:
- Daily revenue and orders
- Average order value
- Conversion rate
- Website sessions
- ROAS and ad spend
- CAC and customer acquisition trends
- Cart abandonment
- Product performance
- SKU performance
- Repeat purchase rate
- Customer retention
This is valuable, especially for early-stage ecommerce brands. A founder who previously relied on scattered reports can use a dashboard to understand business performance faster.
However, visibility is only the starting point. As the brand grows, the founder does not only need to see numbers. They need to understand what those numbers mean together.
The Real Limitation of Traditional Ecommerce Dashboards
The main limitation of traditional Ecommerce Dashboards is not that they lack data. In many cases, they show too much data.
The problem is that most dashboards are designed for reporting, not decision-making.
A dashboard may tell you that conversion rate dropped from 2.8% to 2.1%. It may also show that ROAS fell, CAC increased, and cart abandonment went up. But it may not clearly explain whether the root cause is poor traffic quality, slow website speed, weak product availability, pricing friction, landing page issues, campaign fatigue, or checkout problems.
This creates a gap between reporting and action.
For example, imagine a D2C skincare brand sees a 12% revenue drop in one day. A traditional dashboard may show the decline clearly. But the growth team still needs to check Shopify, Meta Ads, Google Ads, GA4, product availability, and checkout behaviour to understand what happened.
The founder may spend the first half of the day asking questions like:
- Was traffic down?
- Did Meta Ads underperform?
- Did the conversion rate drop?
- Did a top-selling SKU go out of stock?
- Did cart abandonment increase?
- Is the issue with acquisition, website experience, product demand, or fulfillment?
The dashboard shows the symptoms, but the team still has to find the diagnosis.
This is where dashboard fatigue begins. Teams have access to data, but the decision is still unclear.
Dashboard Fatigue: A Growing Problem for D2C Brands
Dashboard fatigue occurs when an e-commerce team feels overwhelmed with reports but still cannot determine which information should be prioritized.
This is a common phenomenon for scaling D2C businesses since the number of tools rises together with the increase in complexity. While there initially may only have been one Shopify dashboard, soon it will be the norm to monitor several platforms every day.
The usual checks might include:
- Shopify – revenue, sales.
- Meta Ads – ROAS, CTR, CPC, and ad spend.
- Google Ads – search and shopping campaigns.
- GA4 – traffic, sessions, and e-commerce events.
- Klaviyo or CRM – repeat customers and retention metrics.
- Shiprocket or fulfillment – logistics, delivery, RTOs.
- Finance spreadsheets – margins, cash flow, profitability.
Each of these platforms can provide certain pieces of information. However, making the right decision would require looking at all information available.
That’s why the issue is not merely UX-related. Dashboard fatigue is a problem of business decision-making.
For ecommerce brands, this delay can be expensive. A missed ROAS drop, rising CAC, stock risk, or conversion issue can affect revenue quickly. The faster the team can understand the issue, the faster they can act.
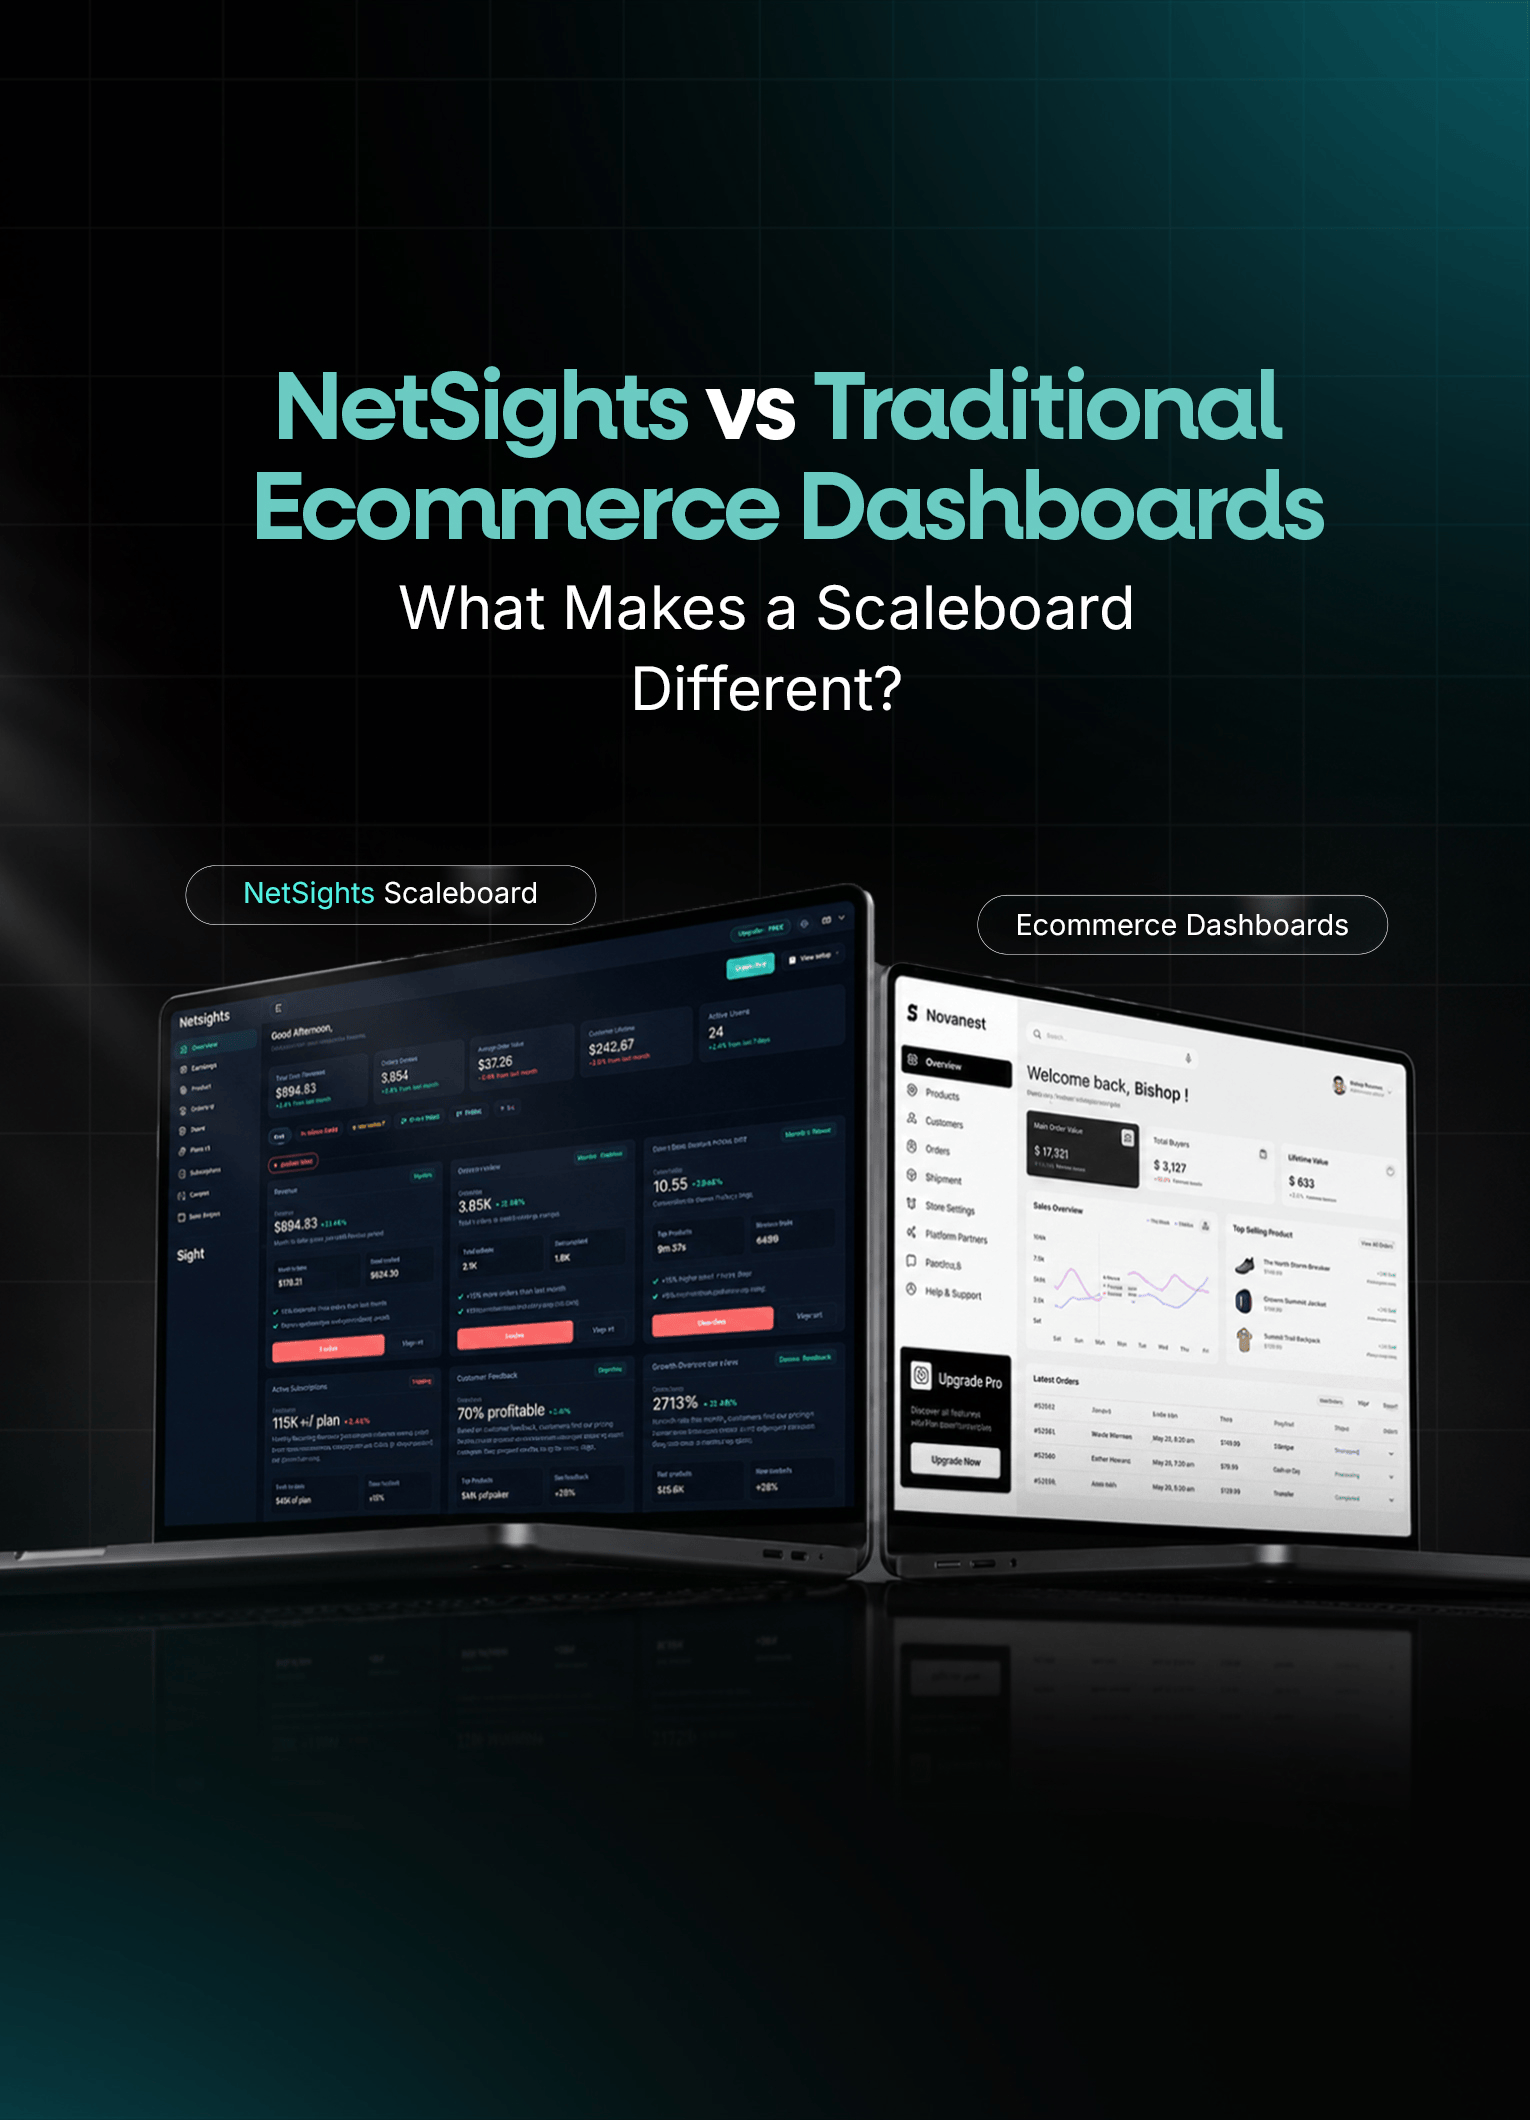
Ecommerce Dashboard vs Scaleboard: The Core Difference
Ecommerce dashboards focus on performance tracking.
Scaleboards focus on performance understanding and action.
Traditional dashboards show what happened through graphs, charts, filters, and metric cards. Scaleboards connect signals across sales, ads, products, customers, and operations to explain why performance changed and what the next step should be.
It is important to understand the difference because ecommerce growth is more than just gathering data. Growth relies on making decisions.
Founders cannot simply rely on CAC increasing to grow their business. They must understand if CAC increased because of a rise in CPC, poor conversion rate, campaign fatigue, low-quality audience, mismatch between product and market, or problems on the landing pages.
Performance marketers cannot simply base their decisions on ROAS dropping. Instead, they must understand if the decline is limited to Meta Ads or is part of a bigger problem affecting all paid media platforms or even impacting store conversions.
Traditional Ecommerce Dashboards vs NetSights Scaleboard
|
Comparison Area
|
Traditional Ecommerce Dashboards
|
NetSights Scaleboard
|
|
Primary Role
|
Shows metrics and reports
|
Turns metrics into decision-ready insights
|
|
Main Value
|
Visibility
|
Clarity, diagnosis, and action
|
|
Data View
|
Charts, graphs, tables, and scorecards
|
Intelligence cards, alerts, recommendations, and connected insights
|
|
User Effort
|
The user interprets data manually
|
AI helps identify what needs attention
|
|
Business Context
|
Often limited by platform or data source
|
Connects sales, ads, customers, products, and operations
|
|
Problem Detection
|
Shows performance movement
|
Helps explain possible causes and business impact
|
|
Decision Speed
|
Depends on manual review
|
Supports faster daily decision-making
|
|
Cross-Platform Understanding
|
Often requires spreadsheets or analyst effort
|
Uses blended metrics and connected performance signals
|
|
Best Use Case
|
Monitoring performance
|
Prioritising action and growth decisions
|
This is not about replacing every dashboard. Dashboards still have a place. The real difference is that a Scaleboard sits closer to decision-making.
Want to move from static reports to decision-ready ecommerce insights?
Where Traditional Ecommerce Dashboards Still Work Well
A balanced comparison is important. Traditional Ecommerce Dashboards are far from useless; they remain useful in cases where simple reporting, fast monitoring, or a historic perspective on data is required.
Such tools fit well when the task is to monitor the revenues for the day, week, or month, analyze the results of advertising campaigns, see how the traffic behaves, export reports, or just show what is happening in the company to date.
This is quite enough for smaller stores, especially those with a limited number of SKUs, marketing channels, and employees.
Moreover, a traditional dashboard is a good tool for team management – a marketing manager can control campaigns with its help, an operations manager can monitor the orders and delivery, while the founder will see revenues at first glance.
Nevertheless, the issue arises when the company begins to grow and requires faster decision-making processes.
Where a Scaleboard Becomes More Useful
A Scaleboard is especially relevant when performance of an ecommerce business depends on several interrelated variables.
For instance, a D2C clothing brand increases its Meta Ads budget by 30%. The revenue grows somewhat, while the profitability remains unchanged. In a regular dashboard, one will see the ad spend, revenues, and ROAS displayed separately. What really matters, however, is that CAC increased, AOV stayed the same, discounts squeezed margins, and repeat purchases remained untouched.
Under such circumstances, the founder certainly does not need another chart. Instead, he requires a better understanding of what’s happening in his business.
The use of Scaleboards is justified by the following conditions:
- The ad budget is growing across multiple channels.
- Revenue growth is obvious, while profitability is unknown.
- One faces a divergence between ROAS and CAC.
- Demand for the products fluctuates rapidly.
- Inventory influences marketing decisions.
- Retention of customers becomes crucial for scaling.
Founders need answers faster than weekly dashboards can provide.
More and more time goes into preparing reports rather than working on actions suggested by them.
This is what separates an AI Scaleboard from a regular ecommerce reporting tool. It connects data, adds context, and helps teams move closer to action.
Same Data, Different Output: A Practical Ecommerce Example
Let us take a realistic ecommerce situation.
A Shopify-based D2C brand checks its performance at 10 AM and sees the following:
|
Metric
|
Yesterday’s Change
|
|
Revenue
|
Down 11%
|
|
ROAS
|
Down 18%
|
|
CAC
|
Up 14%
|
|
Conversion Rate
|
Down from 2.7% to 2.1%
|
|
Cart Abandonment
|
Up 8%
|
|
Top SKU Stock
|
Low inventory warning
|
A traditional ecommerce dashboard will show these changes as individual metrics. The founder can see that performance is weaker, but the team still needs to investigate the reason.
A Scaleboard-style approach looks at the relationship between these metrics.
The revenue drop may not be only an ad issue. ROAS is down, but conversion rate is also down. Cart abandonment is up, and a top SKU has low stock. This suggests that the team should not only pause ads or reduce budget. They may also need to check product availability, landing page experience, checkout flow, and campaign traffic quality.
That is the value of connected decision intelligence. It helps the team start from a better question.
Instead of asking “Which number changed?” the team can ask “Which issue is causing the biggest business impact?”
See how NetSights helps ecommerce teams connect scattered metrics and act faster.
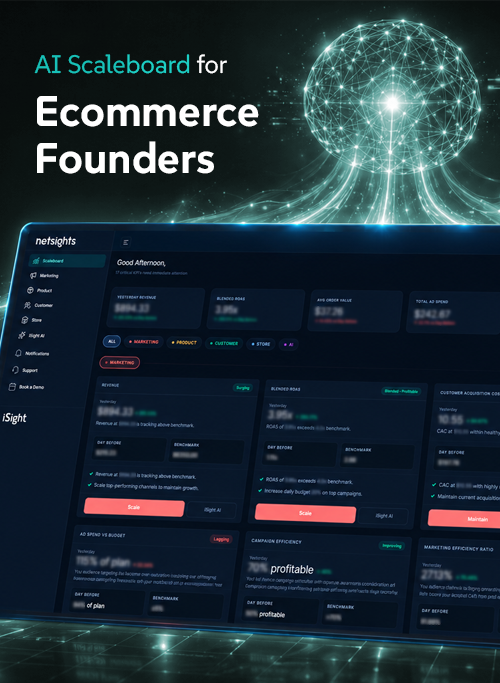
How NetSights Brings the Scaleboard Approach to Ecommerce
NetSights uses the Scaleboard methodology in ecommerce analytics by linking business information and turning them into better insights for founders, growth teams, and agencies.
The whole product is built around ecommerce growth metrics including revenue, ROAS, CAC, AOV, conversion, LTV, product success, retention, inventory flow, blended CAC, and LTV ratio.
Rather than presenting itself as just another dashboard, NetSights aims to help ecommerce teams identify what requires attention, why it is important, and how to address that issue.
The NetSights AI Scaleboard, in its larger context, links together ecommerce data collected from platforms such as Shopify, Meta Ads, Google Ads, GA4, Search Console, Klaviyo, Shiprocket, Razorpay, Stripe, and many others.
This is important as, in ecommerce, growth does not hinge on just one parameter at a time.
A decrease in revenue can be driven by a number of factors like traffic issues, ad spend inefficiency, problems with products, issues with inventory management, retention rate problems, checkouts, and customer behavior.
NetSights is a solution that was built around that concept.
The Role of iSight, Netification, and Netty
The first NetSights blog may already explain these product layers in detail, so this section should stay focused on how they support the dashboard vs Scaleboard difference.
iSight: From Manual Analysis to Revenue Intelligence
iSight AI revenue intelligence supports the Scaleboard approach by analysing ecommerce performance signals and helping teams understand what may need action. Instead of waiting for manual analysis, iSight helps identify performance changes, possible causes, and recommended next steps.
This is useful for growth teams that need to understand revenue drops, ROAS movement, CAC changes, product risks, and month-end revenue direction.
Netification: From Passive Reporting to Active Alerts
KPI alerts from netification ensures that ecommerce staff get updates without relying solely on dashboard reviews manually. The system provides daily performance updates and raises alarms where specific KPIs reach certain levels.
This enables rapid response in case there is decline in revenue, blended ROAS, stock, or conversion rate.
Netty: From Dashboard Search to Conversational Insights
Netty WhatsApp AI Copilot makes business insights easier to access through conversation. Instead of searching through multiple reports, founders can ask business questions and get clearer answers through WhatsApp.
For lean ecommerce teams, this reduces the friction between noticing a problem and understanding what to do next.
Why Blended Metrics Matter in This Comparison
Another major drawback of the traditional Ecommerce Dashboards is that they present platform metrics.
Indeed, while metrics related to each particular platform may be valuable, they do not always depict the cost of acquiring customers or the quality of growth.
For instance, Meta Ads might show the Return on Ad Spend calculated according to their attribution model. Google Ads will demonstrate performance of its campaigns; Shopify – total sales; GA4 – website traffic and ecommerce events; finance – margin impact.
However, founders require blended metrics representing several dimensions of a business.
Calculations such as Blended CAC allow founders to better analyze how much money the company spends on acquiring new customers through multiple channels, tools, fees, and orders.
LTV Ratio provides an answer to the question whether the acquisition of clients is viable.
Indeed, although a brand may be generating more revenue, it might still face serious problems once the customer lifetime value cannot cover the cost of customer acquisition.
This is when using a Scaleboard proves beneficial.
Why This Comparison Matters for Ecommerce Brands
The purpose of this comparison is not only to bring forward yet another classification in the field of ecommerce analytics. Rather, it is meant to make founders, growth teams, and agencies grasp why numerous businesses have trouble turning data into actions despite having access to numerous dashboards.
Almost all ecommerce brands today use a number of different systems in order to measure their performance. They get insights on their revenues, orders, ROAS, CAC, conversion rates, customer behavior, and product performance. However, many teams continue wasting a great deal of effort trying to figure out where exactly the focus should be placed first and what step could lead to positive growth.
That’s why the comparison of traditional Ecommerce Dashboards and a Scaleboard can prove to be so useful. The topic we will discuss is not about getting any additional insights. Rather, it is about making the best possible use of all information available to us.
Going through such issues as blended metrics, revenue intelligence, KPI alerts, customer acquisition costs, retention performance, inventory signals, and cross-platform analytics will allow us to highlight the difficulties ecommerce companies experience daily.
For readers evaluating ecommerce analytics solutions, understanding this distinction can make it easier to choose tools that align with their stage of growth, reporting needs, and decision-making requirements.
When Should a Brand Move Beyond Traditional Ecommerce Dashboards?
A brand does not need to move beyond dashboards on day one. But as complexity grows, the limits become easier to see.
An ecommerce brand should consider a Scaleboard approach when the team checks multiple tools every morning but still struggles to identify the top priority.
It may also be time to move beyond static reporting when weekly reports are too slow, CAC and ROAS are reviewed separately, product and customer data are not connected, inventory issues affect marketing decisions, or performance problems are found only after revenue has already been impacted.
The shift is not from “dashboard” to “no dashboard”. The shift is from passive reporting to decision intelligence.
In practical terms, this means the founder can move from asking:
“What happened yesterday?”
to asking:
“What changed, why does it matter, and what should we do next?”
That shift is what makes a Scaleboard different.
Practical Use Cases for Ecommerce Teams
Use Case 1: Growth Team Reviewing Paid Media
A performance marketing team may see that Meta Ads ROAS dropped and Google Ads CPC increased. A dashboard can show both metrics. But a Scaleboard can help connect these changes with conversion rate, AOV, landing page performance, and revenue impact.
This helps the team decide whether to adjust budgets, pause campaigns, test creatives, review product pages, or check demand quality.
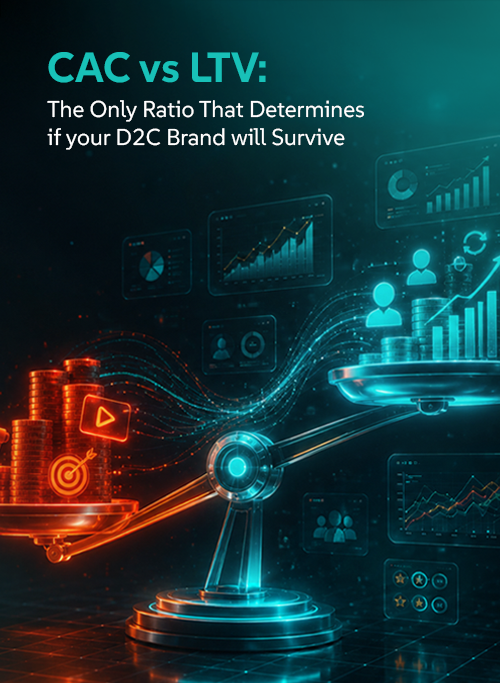
Use Case 2: Founder Tracking Profitability
A founder may see revenue increasing and assume the business is healthy. But if CAC is rising, discounts are high, and repeat purchase rate is low, growth may not be profitable.
A Scaleboard helps connect revenue tracking with blended CAC, LTV ratio, customer retention, and margin-sensitive signals.
Use Case 3: Agency Managing Multiple D2C Brands
An ecommerce agency may manage several Shopify stores across categories. Traditional dashboards can help with reporting, but client recommendations need more context.
A Scaleboard can help agencies identify which accounts need attention, which campaigns are wasting spend, which brands have inventory risk, and where growth opportunities may exist.
Use Case 4: Operations Team Managing Inventory Risk
A top product may be driving strong sales, but if stock is low, scaling ads may create problems. A dashboard may show product performance and inventory separately.
A Scaleboard can connect product demand, SKU velocity, inventory movement, and revenue risk so teams can plan more carefully.
Why Ecommerce Dashboards Need to Evolve Into Decision Engines
Traditional Ecommerce Dashboards helped ecommerce brands become more data-aware. They made performance easier to monitor and gave teams access to important business metrics.
But modern ecommerce growth needs more than data visibility.
Founders need to know which metric deserves attention, why it changed, how it affects the business, and what should be done next. This is where the Scaleboard approach becomes more relevant.
NetSights helps ecommerce teams move from static reporting to connected decision intelligence. With AI-powered insights, blended metrics, intelligence cards, KPI alerts, WhatsApp insights, iSight, Netification, and Netty, it gives founders and growth teams a more practical way to act on ecommerce data.
If your team is still switching between multiple dashboards and spending too much time deciding what to fix first, it may be time to move beyond reports.
Start your free trial with NetSights and turn scattered ecommerce data into clearer, faster growth decisions.