
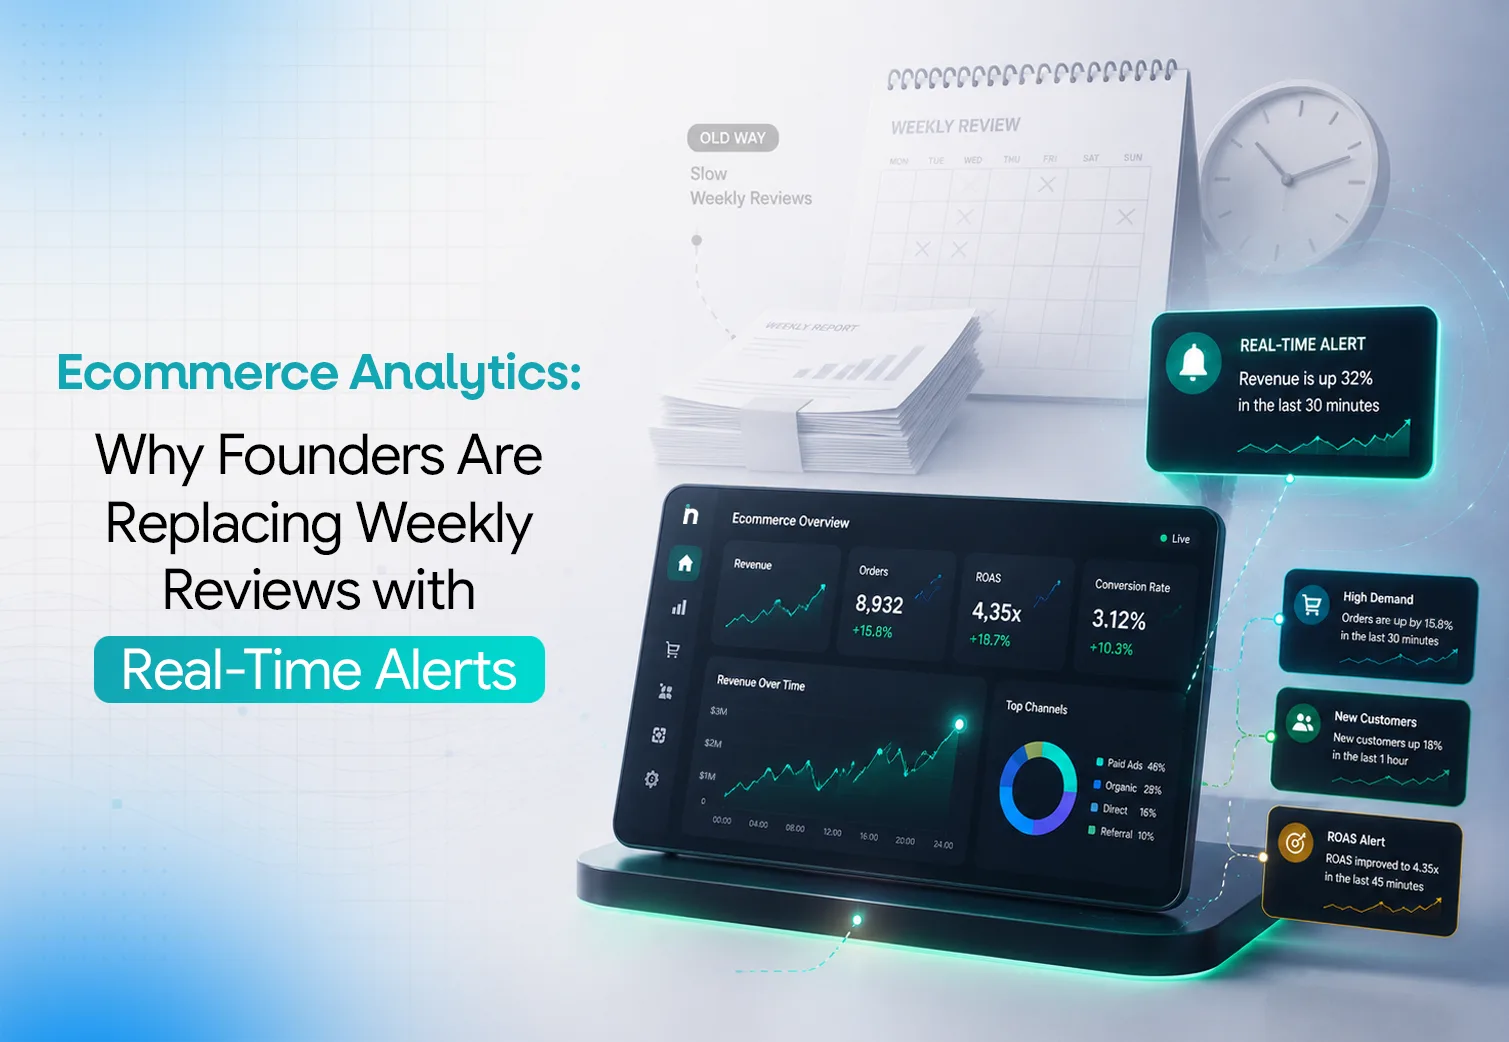
For years, the weekly ecommerce review worked well enough.
A founder or growth team would open Shopify, review Meta Ads and Google Ads, check GA4, pull CRM and retention data, update a spreadsheet and meet at the end of the week to discuss performance.
That process still has value.
The problem is that weekly reporting is too slow to act as an early-warning system.
If conversion starts falling on Tuesday, discovering it during Friday’s review could mean several days of lost revenue. If advertising spend increases without a matching rise in sales, the budget keeps disappearing. If a bestselling product is running out of stock, marketing may continue creating demand that the business cannot fulfil.
This is why ecommerce analytics is changing.
Founders still need weekly reviews for strategy, planning and deeper analysis. But they increasingly need real-time ecommerce analytics, ecommerce KPI alerts, anomaly detection and automated monitoring to identify important changes while there is still time to respond.
The difference is simple:
Weekly reviews tell you what happened.
Real-time monitoring tells you what is changing and whether it needs attention.
For growing D2C brands, that shift can turn ecommerce analytics from a reporting function into a decision-making system.
Stop waiting for the weekly report to discover yesterday’s problem.
Real-time ecommerce analytics is the continuous or near-real-time monitoring of sales, marketing, customer, product and operational data so important performance changes can be identified without waiting for a scheduled report.
It does not mean every metric must update every second.
Different platforms process data at different speeds. Google Analytics, for example, provides a Realtime report for recent website and app activity, while its data freshness documentation explains that reporting intervals vary depending on the dataset.
Shopify also supports event-driven workflows through webhooks, which allow applications to receive information when specific store events occur instead of constantly checking for changes.
For founders, however, the technical definition matters less than the business result.
The goal is to reduce the time between:
Performance change → Detection → Investigation → Decision → Action
Traditional ecommerce reporting may eventually explain what happened.
Real-time ecommerce analytics is designed to help teams recognise important changes earlier.
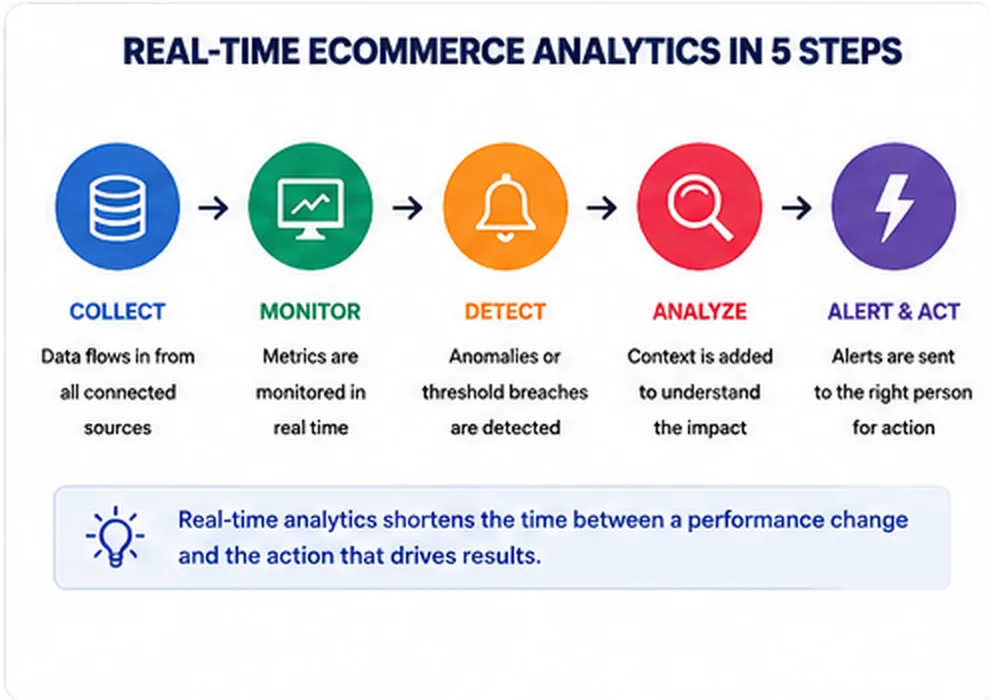
Weekly ecommerce reviews are useful for strategy, but they are often too slow for issues that can affect revenue within hours.
A weekly report can tell you that conversion declined.
It can show that Customer Acquisition Cost increased.
It can reveal that a campaign became less efficient.
The problem is that the business may have already spent several days operating under those weaker conditions.
Imagine a D2C business that holds its performance review every Monday.
Everything looks healthy.
On Tuesday afternoon, mobile conversion starts falling. Traffic remains relatively stable, so paid campaigns continue sending visitors to the store.
Nobody notices until next Monday.
The weekly report eventually reveals the decline, but several days of potential revenue have already been lost.
This is not primarily a lack-of-data problem.
It is a time-to-insight problem.
That is why real-time business reporting and scheduled reports should not be treated as competing approaches.
Weekly reporting provides perspective.
Real-time alerts provide speed.
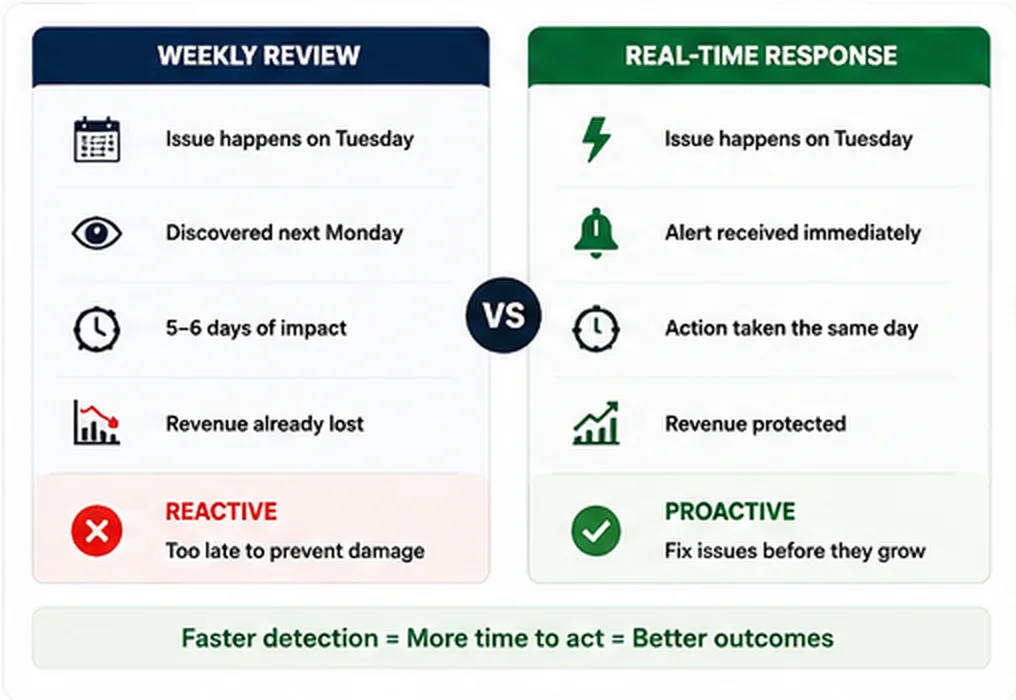
A dashboard waits for someone to inspect it. A real-time alert actively surfaces a change that may need attention.
That difference matters.
Traditional ecommerce analytics dashboards are largely pull-based.
A founder opens the dashboard, selects a period, checks several metrics, compares performance and tries to identify anything unusual.
Real-time ecommerce alerts are push-based.
The monitoring system watches selected KPIs and notifies the relevant person when something important happens.
But alerts should not replace dashboards.
Each serves a different purpose.
| Analytics Layer | Main Purpose | Best Used For |
| Dashboard | Explore performance | Deep analysis and investigation |
| Scheduled Report | Review performance | Daily or weekly summaries |
| Real-Time Monitoring | Watch important KPIs | Early issue detection |
| KPI Alert | Surface an exception | Immediate investigation |
| Anomaly Detection | Identify unusual behaviour | Unexpected performance changes |
The strongest ecommerce analytics setup combines these layers.
Explore with dashboards.
Review with reports.
Respond with alerts.
This can also help reduce decision fatigue caused by fragmented analytics. Founders no longer need to continuously inspect every number just to discover whether something deserves attention.
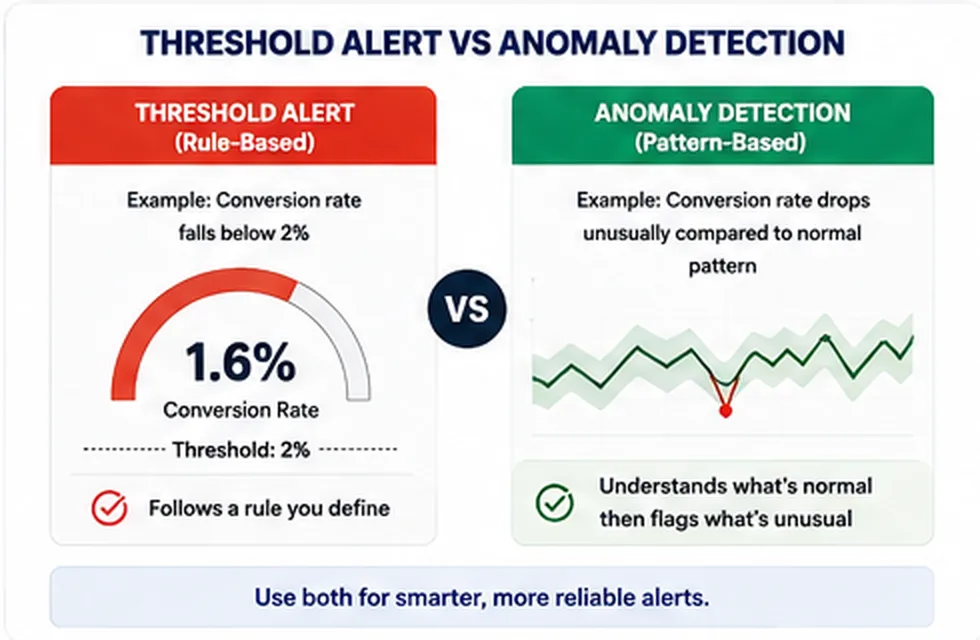
Threshold alerts and anomaly detection both help with ecommerce performance monitoring, but they answer different questions.
A threshold alert follows a predefined rule.
For example:
The business has already decided what level deserves attention.
Threshold alerts are easy to understand and can work well for metrics with clear operating limits.
Ecommerce anomaly detection looks for behaviour that is unusual compared with what would normally be expected.
Context becomes important.
A 20% revenue decline at 3 AM may be perfectly normal.
The same decline at 3 PM during a major campaign could indicate something worth investigating.
Microsoft researchers have described time-series anomaly detection systems that continuously monitor business metrics, including revenue, and identify abnormal behaviour automatically. Their research on time-series anomaly detection illustrates how monitoring systems can move beyond fixed rules.
The difference can be summarised simply:
Threshold: “This KPI crossed a limit we set.”
Anomaly: “This KPI is behaving differently from what we normally expect.”
A strong AI-powered ecommerce analytics system can use both.
Not every ecommerce metric deserves an immediate notification.
A KPI is a strong candidate for real-time monitoring when a significant change could affect revenue, profitability, customer experience or operations before the next scheduled review.
| Area | Useful Real-Time Signals | Business Question |
| Revenue | Revenue or order decline | Is store performance weakening? |
| Conversion | Unexpected conversion drop | Are visitors reaching the store but not buying? |
| Advertising | Spend spike, CAC rise, ROAS decline | Is acquisition efficiency deteriorating? |
| Products | Sudden demand rise or decline | Has product performance changed? |
| Inventory | Low stock or stockout risk | Can inventory support current demand? |
| Store | Checkout or cart deterioration | Is buying friction increasing? |
| Retention | Unusual repeat-purchase decline | Is customer quality weakening? |
The key word is actionable.
Customer Lifetime Value matters enormously, but it usually develops over a longer period and rarely requires an instant response.
Revenue, conversion, orders and advertising spend can change quickly, making them stronger candidates for ecommerce performance alerts.
That is different from the broader set of weekly ecommerce metrics founders should review.
Weekly reporting monitors overall business health.
Real-time monitoring watches for exceptions.
Founders should use both.
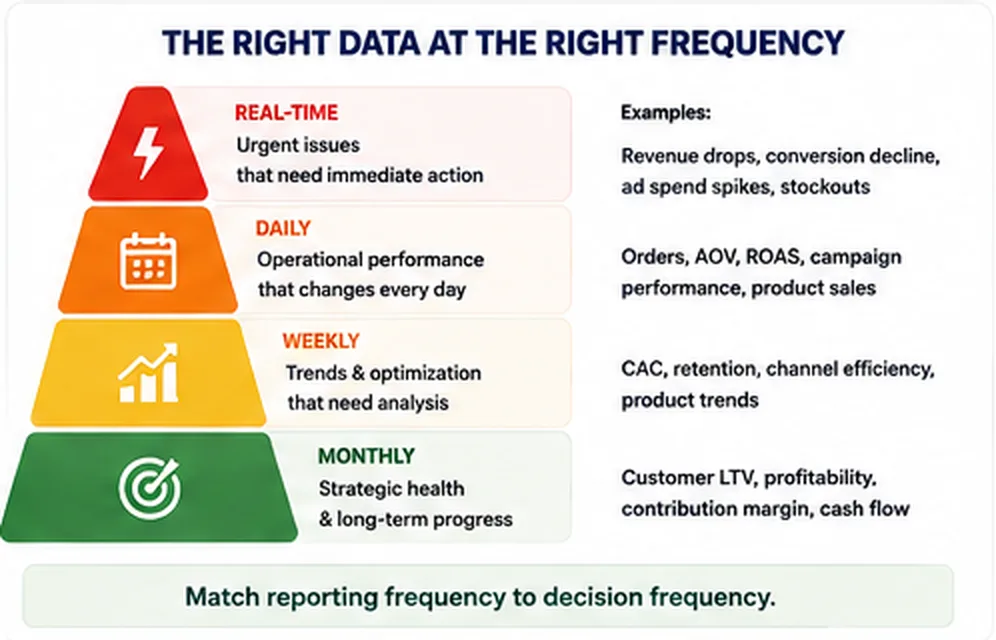
Real-time alerts and weekly reviews answer different business questions.
What needs attention now?
Useful for:
What changed today?
Useful for:
What does the pattern mean?
Useful for:
Are we moving towards the larger objective?
Useful for:
The principle is simple:
Match reporting frequency to decision frequency.
The faster a business decision needs to happen, the faster the relevant signal needs to surface.
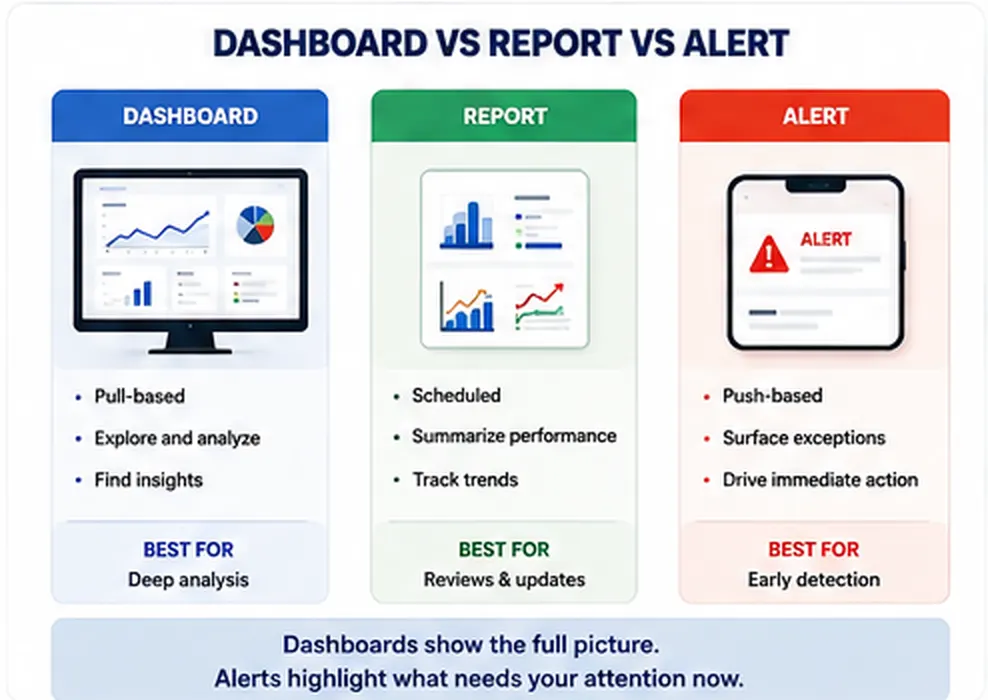
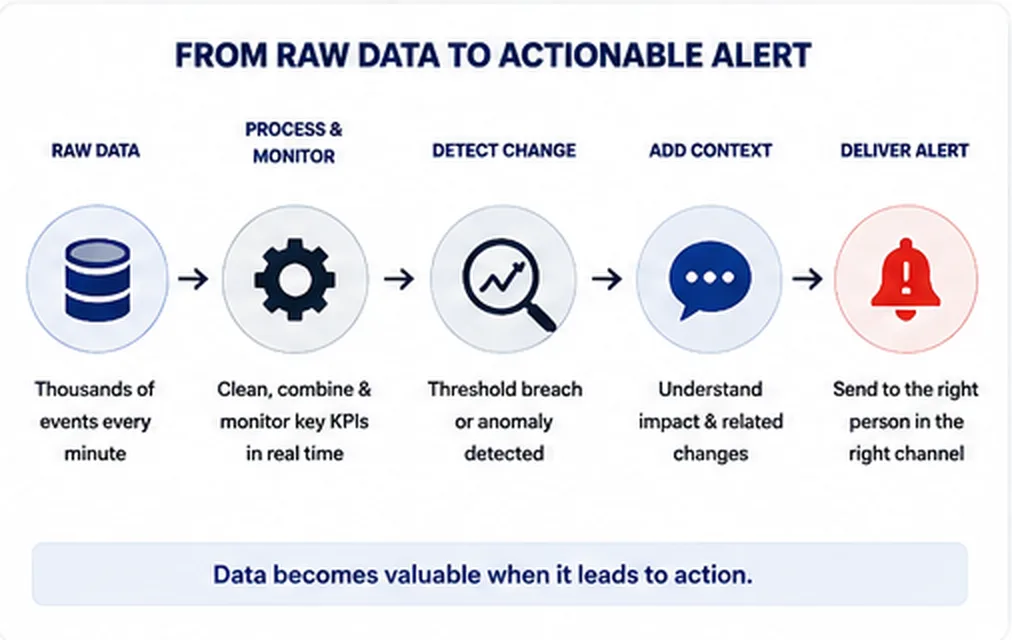
Real-time ecommerce alerts monitor connected KPI data and notify the relevant person when a threshold is crossed or unusual behaviour is detected.
A useful system generally follows six steps.
A D2C business may use Shopify, Meta Ads, Google Ads, GA4, Klaviyo, Mailchimp, Omnisend, inventory systems and payment platforms.
The objective is not simply to put everything in one place.
It is to connect metrics that explain one another.
A revenue decline means something very different when traffic is also falling than when traffic is stable but conversion has weakened.
Ecommerce analytics automation is only as reliable as the numbers being automated.
CAC, blended ROAS, repeat purchase rate, contribution margin and revenue should have agreed definitions.
Otherwise, the business simply automates conflicting versions of the truth.
Performance has patterns.
Monday may behave differently from Saturday.
Morning traffic may convert differently from evening traffic.
Black Friday should not be compared with an ordinary trading day without context.
A useful monitoring system needs an understanding of normal behaviour before it can reliably identify unusual behaviour.
The system continuously evaluates selected metrics against thresholds, historical patterns or both.
This is where real-time KPI tracking becomes proactive rather than passive.
An alert that says:
Revenue down 15%
is useful.
An alert that says:
Revenue is down 15%. Traffic is stable, but mobile conversion has declined.
is far more actionable.
Context helps narrow the investigation.
Alerts lose value if a founder needs to remember to open another dashboard to find them.
Depending on the workflow, ecommerce KPI alerts can be delivered through WhatsApp, Slack, email or another operational channel.
Real-time monitoring becomes easier to understand when it is connected to actual business situations.
Imagine a store normally generates approximately $30,000 per day.
By mid-afternoon, revenue is tracking significantly below its expected level.
A dashboard may already contain that information.
But the dashboard only helps if someone checks it.
An ecommerce real-time alert can surface the change earlier.
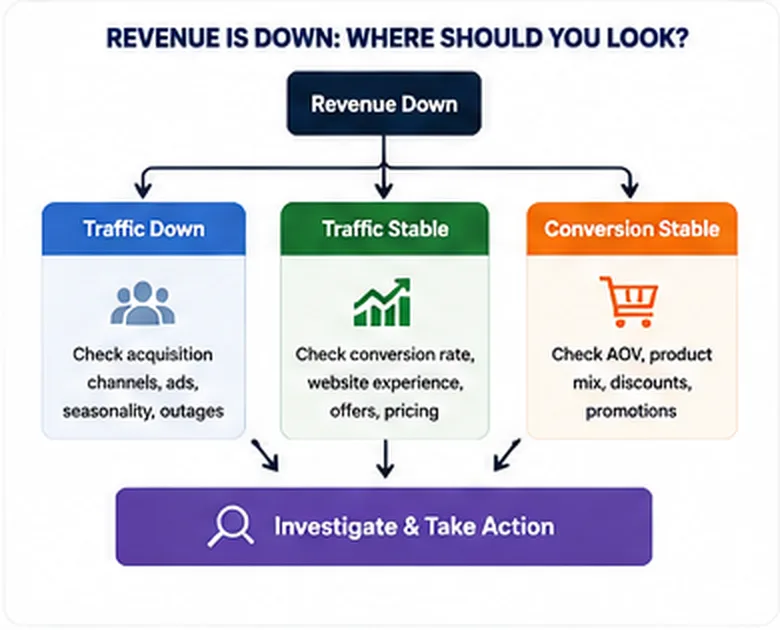
The next question is why.
If traffic has fallen, acquisition may deserve attention.
If traffic is stable but conversion is down, the website experience may be the better place to investigate.
If conversion remains stable but AOV falls, product mix, promotions or discounts may explain the decline.
This is the difference between receiving an alert and using ecommerce decision intelligence.
An alert tells you what changed.
Connected analytics helps determine where to look next.
Suppose advertising spend increases aggressively during a promotion.
Orders also increase, so the campaign initially looks successful.
But spending is growing much faster than revenue.
If nobody reviews the relationship until the following week, several more days of budget may be spent inefficiently.
A real-time performance alert can highlight that divergence earlier.
The team can then review CAC, blended ROAS, conversion and contribution margin before deciding whether to continue scaling.
This is more useful than asking whether one advertising platform still reports an attractive ROAS.
For a broader acquisition-efficiency framework, use this 12-point ROAS optimisation checklist.
Real-time does not always mean minute by minute.
Retention metrics generally move more slowly.
A CRM or retention team may instead want to know when repeat purchase behaviour, returning-customer revenue or the performance of an important customer cohort moves materially outside its expected range.
That could trigger an investigation into:
This is why customer retention and acquisition should be analysed as connected parts of the same growth system.
More alerts do not automatically create better ecommerce analytics.
Too many alerts can make monitoring worse.
If founders receive twenty notifications every day, everything begins to feel equally urgent. Eventually, alerts become background noise.
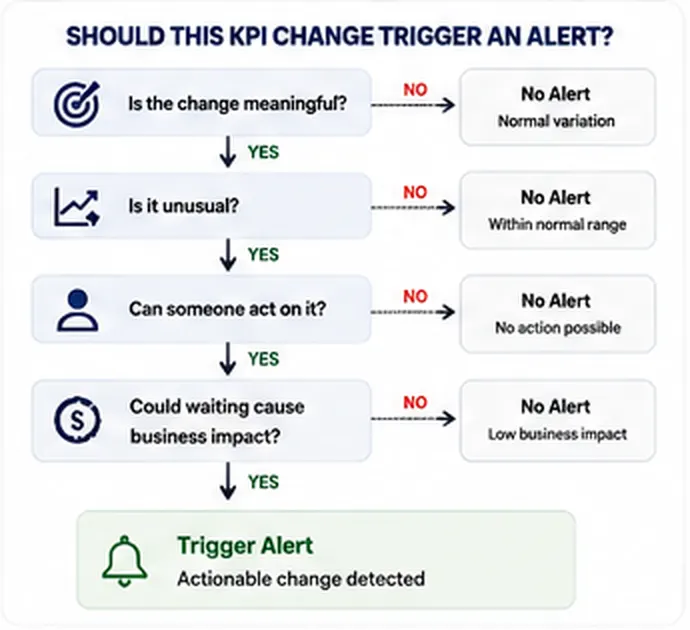
A useful ecommerce alert should answer four questions:
Google’s Site Reliability Engineering guidance on monitoring applies a similar principle in a technical environment: alerts should focus human attention on conditions that actually require a response.
The same principle works for ecommerce performance monitoring.
A 0.1% conversion movement may simply be normal variation.
A sustained conversion decline during a major campaign may deserve immediate investigation.
Good alerting therefore means:
Not every metric should be monitored in real time.
Metrics that develop slowly or require a longer observation period are often better suited to daily, weekly or monthly analysis.
Examples include:
Reacting immediately to every small change can create poor decisions because normal business fluctuations may look more important than they really are.
Real-time monitoring should therefore be selective.
Use alerts for urgent exceptions.
Use scheduled reporting for patterns.
Use longer-period analysis for strategic decisions.
NetSights is designed to help ecommerce teams move beyond fragmented dashboards towards connected ecommerce decision intelligence.
Instead of requiring founders to manually compare separate marketing, product, customer and store reports, the NetSights ecosystem connects performance monitoring, anomaly detection, automated reporting and conversational analysis.
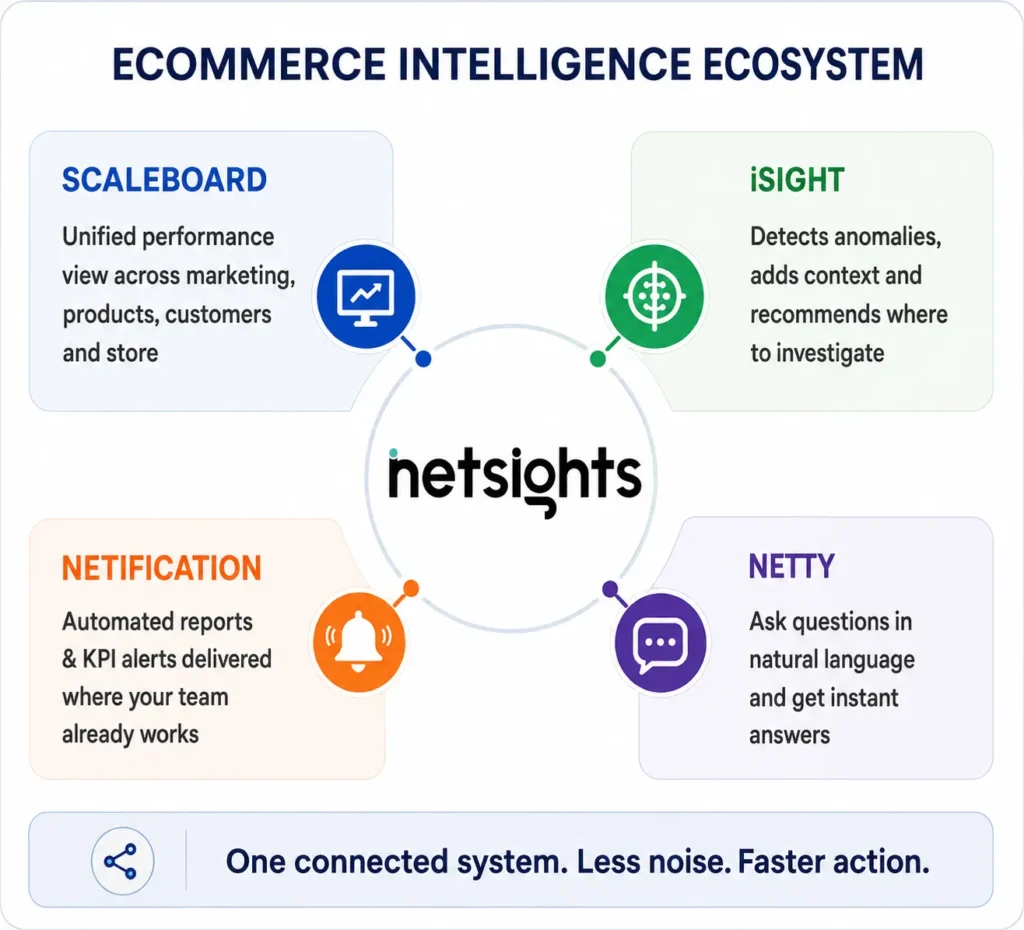
The NetSights Scaleboard brings signals from marketing, products, customers and store performance into one founder-level view.
That context matters.
That is why there is an important difference between traditional ecommerce dashboards and a Scaleboard.
iSight is the intelligence layer designed to monitor ecommerce performance and surface important changes.
Its role is not simply to say that a metric moved.
The more useful questions are:
That moves ecommerce anomaly detection closer to decision support rather than simple notification.
Netification is the automated reporting and notification layer.
It helps deliver performance reports and selected KPI alerts through channels such as WhatsApp, Slack and email.
That changes the workflow from:
Open dashboards → Search for problem → Investigate
to:
Receive meaningful signal → Investigate → Decide
This is where automated KPI reporting becomes useful for founders rather than simply producing another report.
Netty adds a conversational layer to ecommerce analytics.
Instead of finding the correct dashboard, filter and report, a user can begin with the business question.
For example:
The purpose is to shorten the distance between the initial signal and deeper analysis.
Together, the workflow becomes:
Connected Data → Detection → Context → Decision → Action
One connected view. Fewer blind spots. Faster growth decisions.
Do not start by creating alerts for every metric.
Start with the KPIs where delayed action could create meaningful financial or operational consequences.
For many D2C brands, that may include:
Then classify each metric according to the reporting speed it actually needs.
Next, define who owns each alert and what they should investigate when it fires.
An alert without an owner creates awareness but not action.
Finally, review the alerting system itself.
If a notification is regularly ignored, either its threshold is wrong or that metric does not deserve an alert.
If the wider reporting process still depends heavily on spreadsheets and manual exports, see how to reduce ecommerce reporting time from 5 hrs to 15 mins.
Weekly reviews still matter.
They give founders and teams the space to understand broader patterns, discuss strategy and decide where the business should focus next.
But the weekly meeting should not be the first time someone discovers that revenue fell on Tuesday, ad spend spiked on Wednesday or conversion weakened during a major campaign.
That is where ecommerce analytics needs to become more proactive.
The strongest reporting model combines dashboards, automated ecommerce reporting, real-time monitoring and carefully designed alerts.
Dashboards provide depth.
Weekly reviews provide perspective.
Alerts provide speed.
Anomaly detection helps identify which changes actually deserve attention.
The goal is not for a founder to monitor the business every minute.
It is exactly the opposite.
A good ecommerce analytics system should monitor the important signals so the founder does not have to.
With NetSights, Scaleboard, iSight, Netification and Netty are designed to connect ecommerce data, surface meaningful performance changes and shorten the journey from signal to decision.
Stop Checking Every Metric. Know When Something Actually Needs You.
A: Real-time ecommerce analytics continuously or frequently monitors ecommerce KPIs so teams can identify important performance changes without waiting for a scheduled report.
A: Real-time analytics helps founders identify revenue, conversion, advertising and operational problems earlier so teams have more time to investigate and respond.
A: Weekly reports are useful for trends and strategy, but they can surface urgent problems several days after they begin. Real-time alerts provide an earlier warning layer.
A: Real-time ecommerce alerts monitor connected KPI data and notify users when a defined threshold is crossed or unusual behaviour is detected.
A: Ecommerce anomaly detection identifies KPI behaviour that differs meaningfully from expected historical or contextual patterns.
A: Revenue, orders, conversion rate, ad spend, blended ROAS, CAC and critical inventory indicators are common candidates because significant changes can require quick action.
A: No. Real-time alerts are better for urgent exceptions, while weekly reporting is better for trends, planning and strategy. Strong ecommerce analytics systems use both.
A: NetSights connects ecommerce performance through Scaleboard, uses iSight for monitoring and analysis, Netification for automated reports and ecommerce KPI alerts, and Netty for conversational follow-up analysis.
We write about growth, retention, and the numbers that actually predict what happens next for D2C brands. Have a topic you'd like us to cover? Get in touch .
Your ecommerce store already contains the answers. Learn how AI ecommerce analytics helps founders ask business questions, understand what changed and why, and move from scattered data to clearer decisions.
Your ecommerce store already contains the answers. Learn how AI ecommerce analytics helps founders ask business questions, understand what changed and why, and move from scattered data to clearer decisions.

Your ecommerce store already contains the answers. Learn how AI ecommerce analytics helps founders ask business questions, understand what changed and why, and move from scattered data to clearer decisions.