
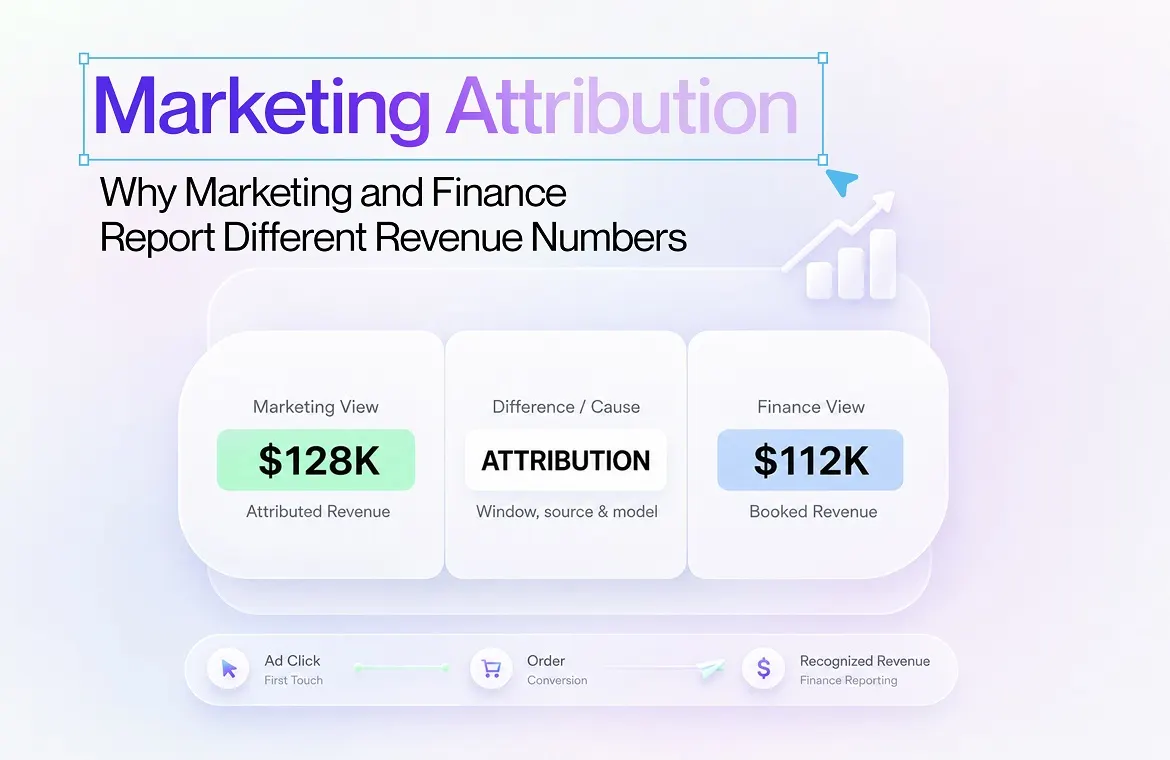
Marketing says campaigns generated $120,000 in revenue.
Shopify reports $108,000.
GA4 shows $94,000.
Finance closes the period at $89,000 in net revenue.
The immediate question is usually:
“Which number is wrong?”
The answer is that none of them is necessarily wrong, they are measuring different things.
But several of these numbers can be valid at the same time.
Marketing platforms measure influence and attribution. Shopify records ecommerce transactions. GA4 tracks digital behaviour and conversion journeys. Payment platforms track money movement. Finance adjusts for discounts, refunds, returns and other transactions to determine what the business actually retained.
That is why marketing attribution and financial reporting rarely match perfectly.
The goal is not to force every platform to show the same number. It is to understand:
What does each number represent?
Why is it different?
Which number should guide the decision being made?
Marketing attribution is the process of assigning credit for a conversion or sale to the marketing touchpoints that influenced the customer journey.
A typical ecommerce journey might look like:
Meta Ad → Google Search → Email → Google Ad → Purchase
There is only one order, but several marketing interactions may have contributed to it.
An attribution model determines how conversion credit is assigned across those touchpoints.
Google Analytics 4 defines an attribution model as a rule, set of rules or data-driven algorithm used to determine how credit is assigned to touchpoints on the path to a conversion. Its attribution reports can also help teams understand how different channels contribute across the customer journey through GA4 attribution reporting.
This means marketing and finance are answering different questions.
Marketing asks: Which channels helped generate the sale?
Finance asks: How much revenue did the business actually record and retain?
That distinction is fundamental.
Attributed revenue is not the same as financial revenue.
A marketing and finance revenue discrepancy usually comes from several factors working together:
Attribution rules → Attribution windows → Reporting dates → Revenue definitions → Tracking → Refunds → Payment settlement
Understanding these differences makes reconciliation much easier.
Consider this journey:
The business generated one $200 order.
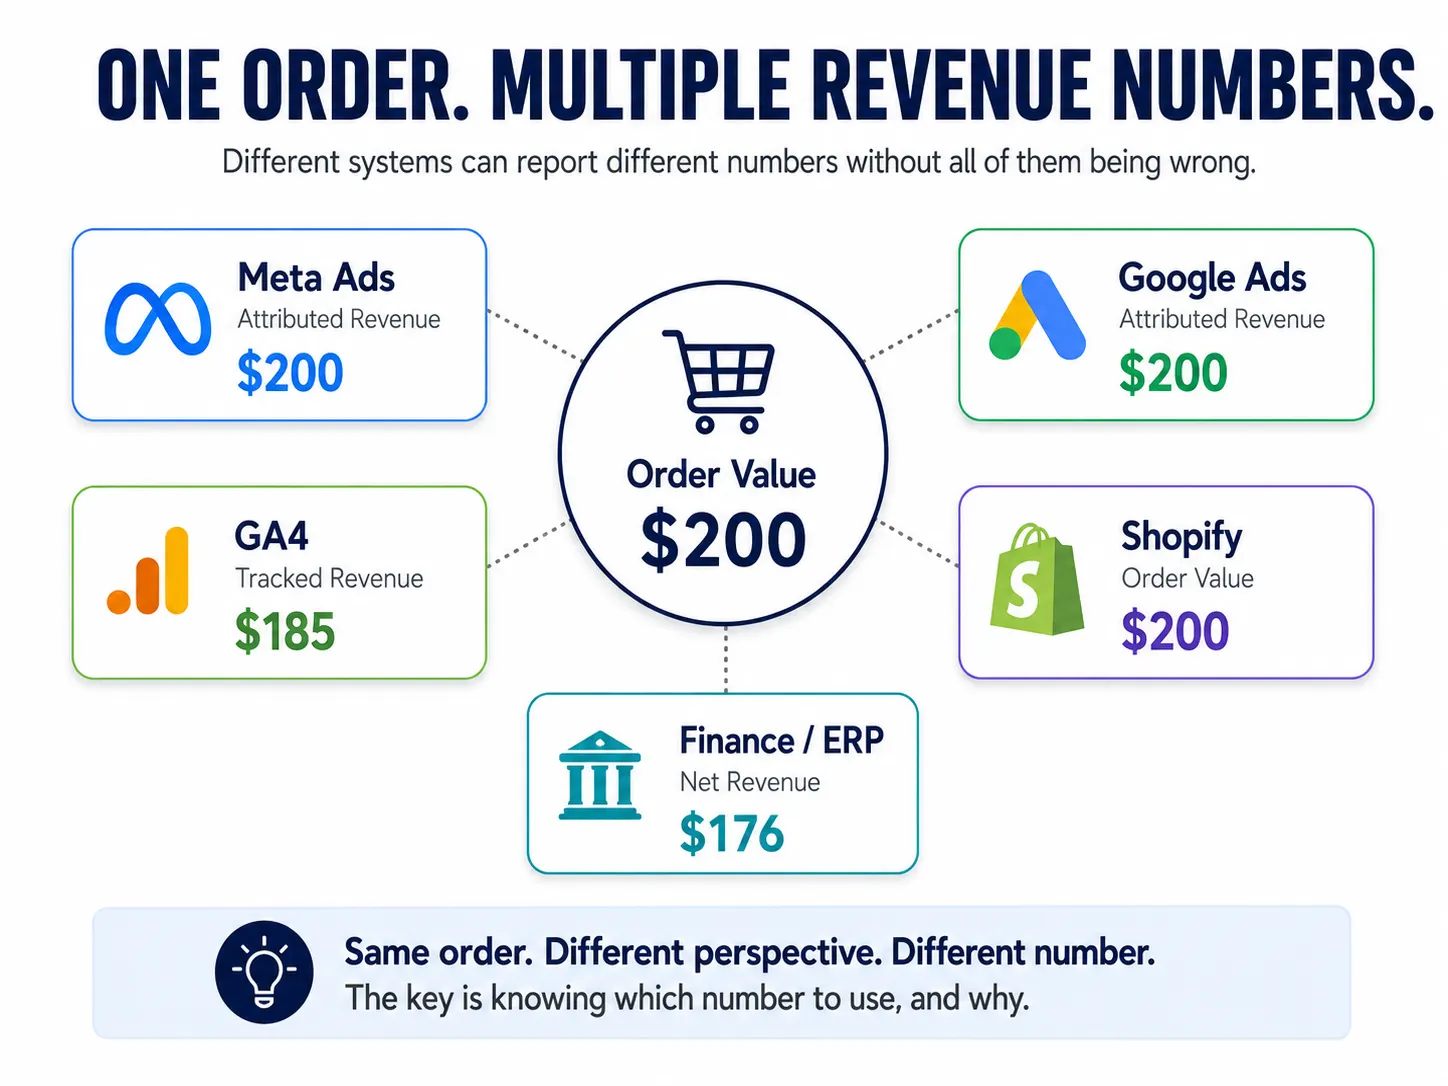
But Meta and Google may both have valid reasons to attribute some or all of that sale to their advertising under their own reporting logic.
Google Ads, for example, uses attribution models to determine how conversion credit is distributed across eligible advertising interactions. Its attribution documentation also demonstrates why multiple touchpoints can contribute to one conversion.
That could produce:
Meta attributed revenue: $200
Google attributed revenue: $200
Shopify revenue: $200
The business did not generate $600.
The advertising platforms are reporting marketing credit, while Shopify records the actual ecommerce transaction.
This is why adding self-reported revenue from several advertising platforms together can overstate actual business revenue.
Research into multi-touch attribution also demonstrates how complex these customer journeys can become. A large-scale attribution system developed for JD.com modelled advertising activity across roughly 300 million users, 160,000 brands, more than 200 ad types and around 80 billion impressions over a typical 15-day period. The ARXIV research illustrates why assigning every purchase to one simple source can be difficult.
The attribution model selected can significantly change which channel appears to be performing best.
Last-click attribution assigns conversion credit primarily to the final eligible interaction.
For example:
Meta → Email → Google Search → Purchase
Google Search may receive the credit even though Meta and email influenced earlier stages of the journey.
This approach is easy to understand, but it can undervalue discovery and consideration channels.
Data-driven attribution attempts to assign credit according to observed contribution patterns rather than applying one fixed rule.
Google’s data-driven attribution model uses account data to estimate how different eligible interactions contribute to conversions.
The important point for founders is:
Attribution is a model of marketing influence. It is not a transaction ledger.
That is why changing attribution models can change reported channel revenue without changing the amount of money the business actually earned.
Customers do not always buy immediately after interacting with an advertisement.
Suppose someone clicks an ad today and purchases five days later.
Whether the sale receives marketing credit depends partly on the attribution or conversion window used by the platform.
Google Ads allows advertisers to configure conversion windows that determine how long after an advertising interaction a conversion can still receive credit.
Therefore:
This alone can create legitimate revenue reporting differences between platforms.
Even when platforms agree that a conversion happened, they may not assign it to the same reporting date.
Consider:
Ad click: 30 June
Purchase: 2 July
One marketing report may connect the conversion to the earlier advertising interaction, while the commerce or finance system records the transaction in July.
Google identifies differences in conversion timing as one reason Google Ads and analytics systems may not show identical totals.
This becomes especially important around:
For a high-volume ecommerce business, even a one- or two-day timing difference can move a meaningful amount of revenue between reports.
Before comparing revenue dashboards, teams need to agree on what the word revenue means.
A marketing platform may report purchase value.
Shopify may report gross sales, net sales or total sales.
Finance may report revenue after returns and discounts.
Stripe or PayPal may report payment and payout activity.
These numbers should not be used interchangeably.
Revenue Type | What It Represents |
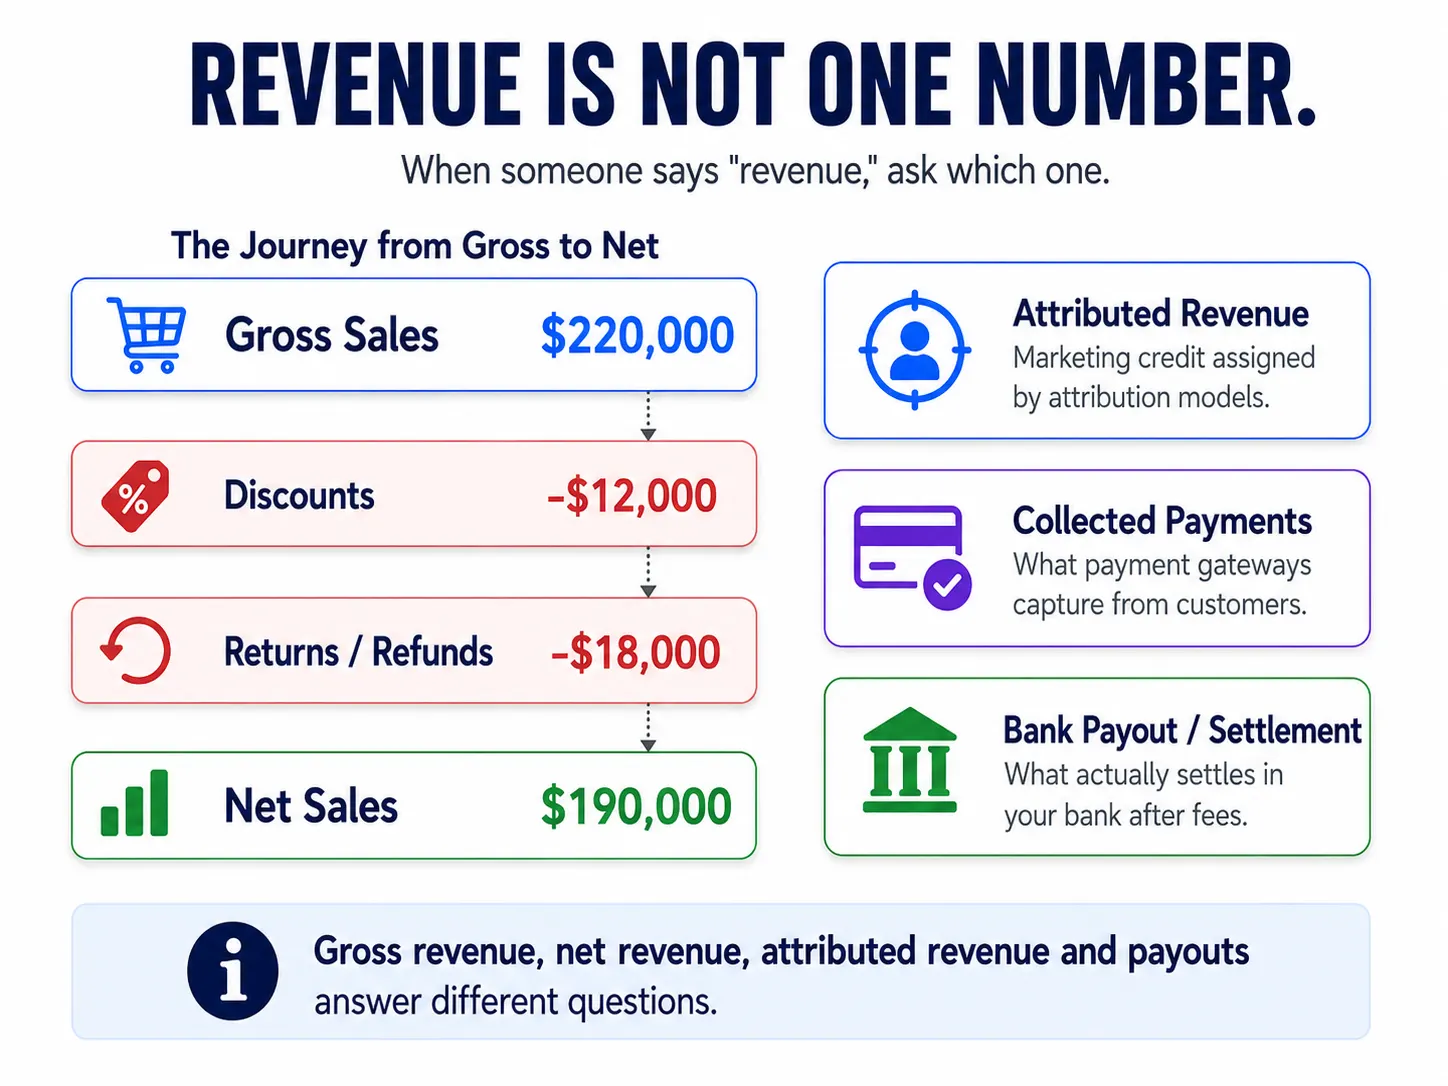
Gross revenue | Sales before discounts and returns |
Net revenue | Revenue after relevant discounts and returns |
Attributed revenue | Revenue credited to marketing activity |
Collected payments | Money successfully captured |
Payout | Money transferred after payment adjustments |
Finance revenue | Revenue recognised under accounting rules |
Shopify’s guidance on sales-report discrepancies explains how returns, refunds and reporting logic can affect the numbers shown across reports.
If Meta reports $120,000 attributed revenue and finance reports $95,000 net revenue, the first question should therefore be:
Are these numbers even measuring the same thing?
A Shopify vs Google Analytics revenue mismatch is common because the platforms collect and process information differently.
Shopify records store transactions.
GA4 relies on ecommerce events being sent correctly from the website or connected systems.
Differences can come from:
Shopify also acknowledges that discrepancies can occur between Shopify Analytics and third-party analytics platforms because the systems use different tracking and reporting methods.
The useful question is therefore not:
“Why doesn’t GA4 exactly match Shopify?”
It is:
“Is the difference expected and explainable, or does it indicate a tracking problem?”
Marketing often considers the conversion complete when the order is placed.
Finance continues tracking what happens afterwards.
Imagine a customer buys $250 worth of products.
Marketing records a $250 purchase.
Three days later, the customer returns a $100 item.
The final commercial value is now different.
Similar differences can come from:
This is another reason marketing revenue vs actual revenue should not be compared without context.
Even finance can contain several valid numbers.
If Shopify reports $100,000 in sales, that does not mean $100,000 will appear in the bank immediately.
Payment processors account for:
Stripe provides a dedicated payout reconciliation report to help businesses connect bank payouts with the transactions that produced them.
This is why:
Ad platform revenue ≠ Shopify sales ≠ payment value ≠ bank payout
Each number represents a different stage of the commercial process.
Another important distinction is the difference between attribution and incrementality.
Attribution asks: Which channel should receive credit?
Incrementality asks: Would the sale have happened without the marketing activity?
Imagine a loyal customer who regularly buys from the brand.
They see a retargeting ad on Wednesday and make a purchase on Thursday.
The ad platform may legitimately receive attribution credit.
But the customer might have purchased it anyway.
That is why attributed ROAS alone does not always reveal the true incremental impact of marketing.
Founders should evaluate platform attribution alongside business-level measures such as blended CAC, contribution margin and customer value. The Netsights ROAS optimisation checklist provides a broader framework for evaluating advertising efficiency.
There should not be one number used for every decision.
There should be a defined source of truth for each question.
Business Question | Best Starting Source |
How much did the store sell? | Shopify |
What revenue remained after adjustments? | Finance / ERP |
What payments were captured? | Stripe / PayPal |
Which channels influenced conversions? | Attribution reporting |
What revenue does Meta claim? | Meta Ads |
What revenue does Google claim? | Google Ads |
Is acquisition efficient overall? | Blended CAC / ROAS |
Is growth profitable? | Net revenue + margin + CAC + LTV |
Finance should not use Meta’s attributed revenue as the accounting ledger.
Marketing should not use a bank payout report to optimise campaigns.
Each dataset needs a clearly defined purpose.
For acquisition decisions, teams should also evaluate CAC versus LTV for D2C profitability rather than treating attributed revenue as the only measure of marketing quality.
Imagine a monthly report shows:
|
System |
Revenue |
|
Meta attributed revenue |
$150,000 |
|
Google Ads attributed revenue |
$110,000 |
|
GA4 purchase revenue |
$205,000 |
|
Shopify gross sales |
$220,000 |
|
Discounts |
-$12,000 |
|
Returns / refunds |
-$18,000 |
|
Net sales |
$190,000 |
At first glance, the numbers look contradictory.
But interpreted correctly, they tell different parts of the same story.
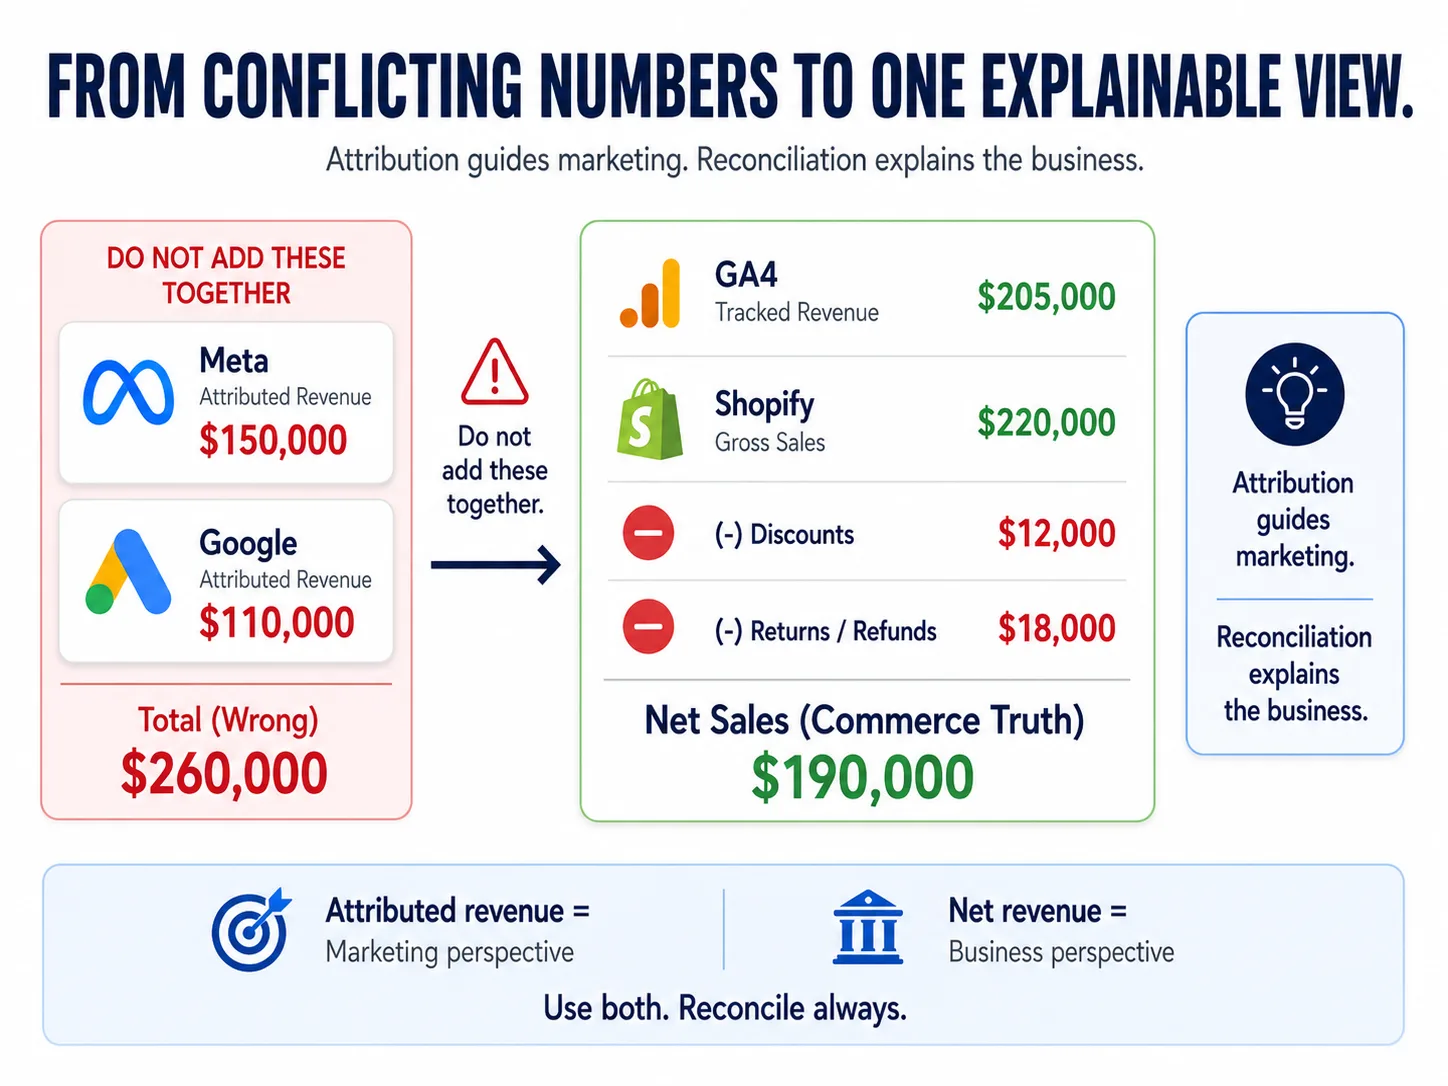
Meta and Google are reporting attribution views. Their combined $260,000 should not be treated as actual sales because both platforms may have credited some of the same orders.
Different numbers become useful when you can explain how they connect.
GA4 measured $205,000 through its analytics implementation.
Shopify recorded $220,000 in gross sales.
After discounts and returns:
$220,000 – $12,000 – $18,000 = $190,000 net sales
Now marketing can use attribution figures for channel analysis, while finance can use $190,000 as its reconciled commercial view.
The better question becomes:
“Can we explain why the numbers differ?”
rather than:
“Which platform is wrong?”
Bring marketing, commerce and performance data together to understand what changed without manually comparing multiple reports.
A strong ecommerce revenue reconciliation process makes differences traceable by systematically aligning data from marketing platforms, analytics tools, and finance systems so you can clearly identify where discrepancies originate and why they occur.
Create a shared data dictionary for:
Everyone should use the same definition when discussing each metric.
Before investigating complex attribution issues, align:
Aggregated data tells you that a discrepancy exists.
Transaction-level data helps explain why.
Where possible, connect:
Transaction ID → Order Value → Attribution → Payment → Refund → Final Revenue
Alongside platform attribution, founders should monitor:
These metrics help determine whether marketing is creating sustainable business growth rather than simply generating attributed revenue.
The DTC unit economics that matter provide further context for evaluating profitable growth.
A single source of truth for ecommerce does not mean choosing one platform and ignoring everything else.
It means defining the role of every system.
A useful structure is:
The challenge is usually not a lack of data.
It is that every platform has different definitions and reports.
That is why moving beyond disconnected ecommerce dashboards becomes increasingly important as a business scales.
Netsights helps ecommerce teams connect marketing, commerce, customer and operational signals instead of analysing each platform in isolation.
Scaleboard brings marketing, product, customer and store performance into one operating view.
For example:
Meta attributed revenue ↑
may initially look positive.
But if:
Blended CAC ↑
Net revenue stays flat
Conversion declines
The overall growth story is very different.
Connected analysis helps founders see these relationships rather than relying on one platform’s attribution number.
That is the principle behind ecommerce decision intelligence.
iSight helps monitor ecommerce performance and surface unusual changes across metrics such as revenue, ROAS, conversion rate, spend and AOV.
Instead of stopping at:
“Revenue numbers don’t match.”
teams can investigate:
Netification supports automated reporting and KPI alerts so teams can identify meaningful changes without waiting for manually prepared reports.
If reporting still requires several hours of spreadsheet work, see how to reduce ecommerce reporting time from five hours to fifteen minutes.
Netty lets ecommerce teams investigate performance through natural-language questions.
For example:
The goal is to move from:
Different dashboards → Different numbers → Internal debate
to:
Connected data → Explained discrepancy → Better decision
One order can have many marketing touchpoints. Your business still needs one reconciled view.
Different revenue numbers do not automatically mean broken data.
Meta Ads, Google Ads, GA4, Shopify, payment processors and finance systems were built to answer different questions.
Marketing needs to understand:
Which channels influenced the customer?
Finance needs to understand:
What revenue did the business actually generate and retain?
A strong marketing attribution framework connects these perspectives.
Define revenue clearly. Standardise reporting periods. Understand attribution models and windows. Reconcile orders at transaction level. Then evaluate marketing using both attribution data and blended business performance.
The goal is not to make every number identical.
It is to make every important difference explainable.
Netsights helps ecommerce teams connect fragmented performance signals and move from conflicting dashboards towards clearer business decisions.
A: Marketing platforms assign revenue using attribution models and windows, while finance records actual transactions and later adjustments such as refunds, returns and discounts.
A: Meta reports attributed revenue based on advertising interactions. Shopify records actual store transactions, so the two figures are not designed to match exactly.
A: Differences can come from event implementation, attribution rules, refunds, time zones, consent settings or tracking limitations.
A: Attributed revenue represents marketing credit assigned to a conversion. Actual revenue represents the commercial transaction and may later change because of discounts, refunds or returns.
A: Cross-channel attribution evaluates how multiple marketing touchpoints contribute to a conversion rather than giving all credit to a single interaction.
A: Not necessarily. The goal is for the differences to be explainable and reconcilable rather than forcing systems built for different purposes to produce identical totals.
We write about growth, retention, and the numbers that actually predict what happens next for D2C brands. Have a topic you'd like us to cover? Get in touch .

A product can be a best performer in your sales charts and still money is lost on each order. Product profitability shows what is left after deducting product costs, discounts, shipping, ads, and returns. Here’s how to analyze the gap between strong sales and healthy profit, and what to do about it. Every Monday, Alisha […]
Your ecommerce store already contains the answers. Learn how AI ecommerce analytics helps founders ask business questions, understand what changed and why, and move from scattered data to clearer decisions.
Your ecommerce store already contains the answers. Learn how AI ecommerce analytics helps founders ask business questions, understand what changed and why, and move from scattered data to clearer decisions.