
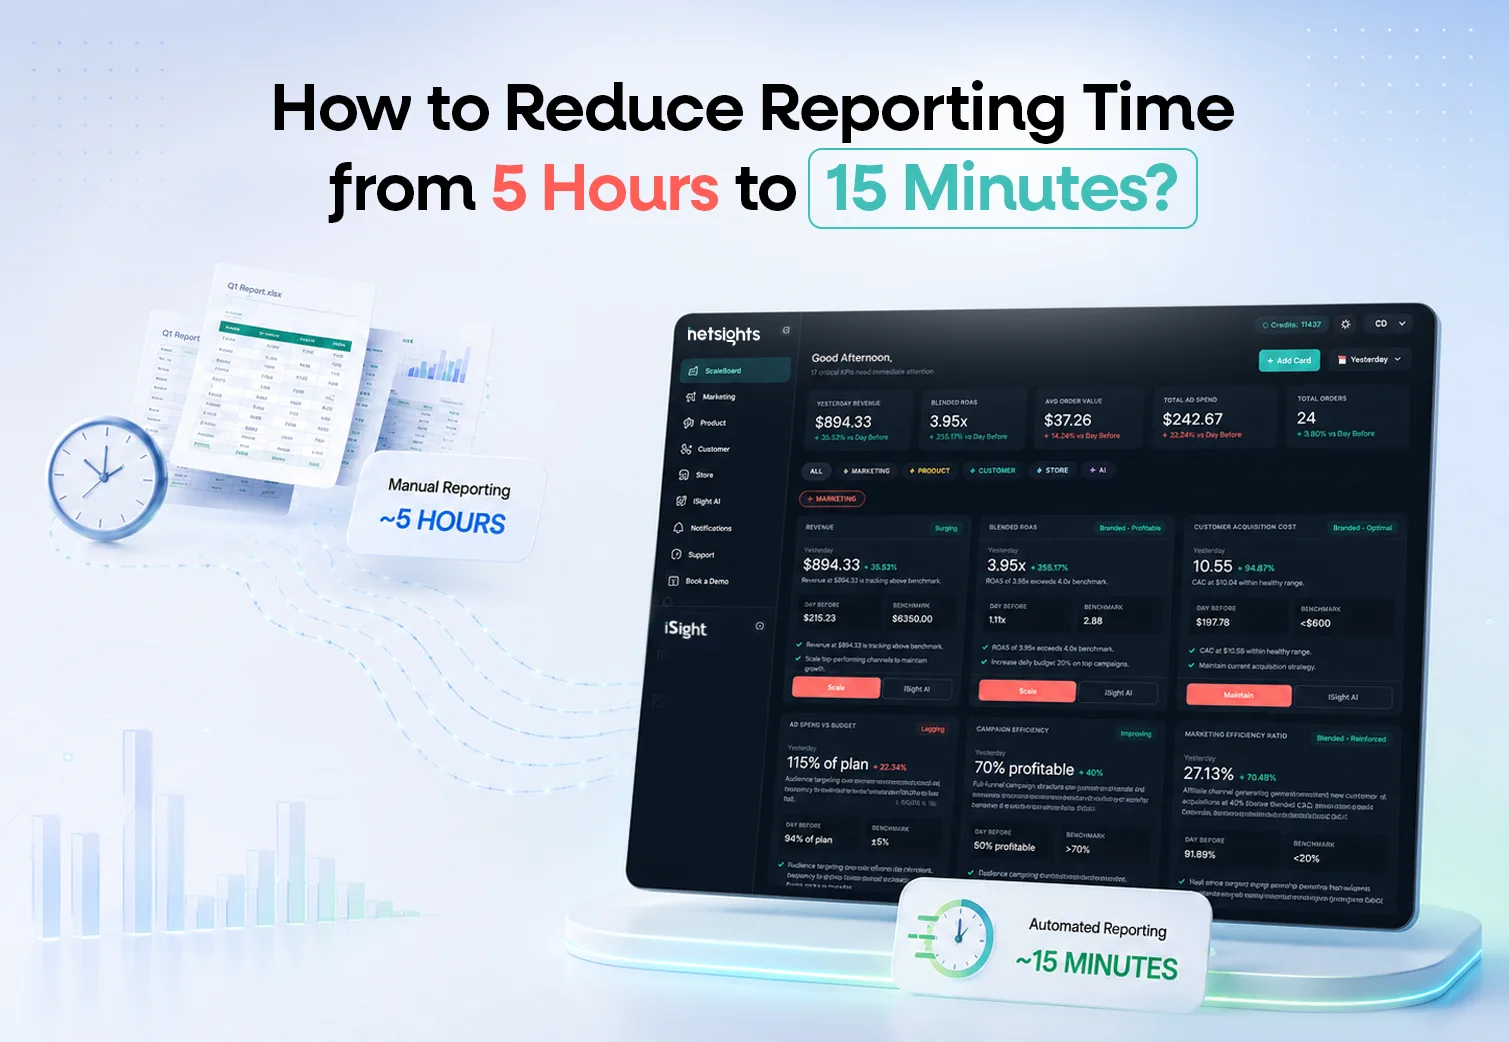
Stop building reports. Start acting on what they reveal.
It is Monday morning, and the growth meeting cannot begin because someone still needs to assemble last week’s numbers.
Revenue and order data sit in the ecommerce platform. Website traffic and conversion data are stored in analytics tools. Advertising spend is spread across multiple accounts. Retention data lives in another system, while product costs and margins are maintained in spreadsheets.
By the time everything has been exported, cleaned, checked and formatted, half the working day has disappeared.
This is not analysis. It is a report assembly.
The problem is not unique to ecommerce teams. The Anatomy of Work Index surveyed 9,615 knowledge workers, while Asana’s annual filing reported that the average knowledge worker spent 58% of the workweek on “work about work” rather than skilled work. A widely cited McKinsey analysis of knowledge work also estimated that interaction workers spent 19% of their working time searching for and gathering information.
For ecommerce teams, manually finding, reconciling and reformatting performance data is a clear example of this hidden workload.
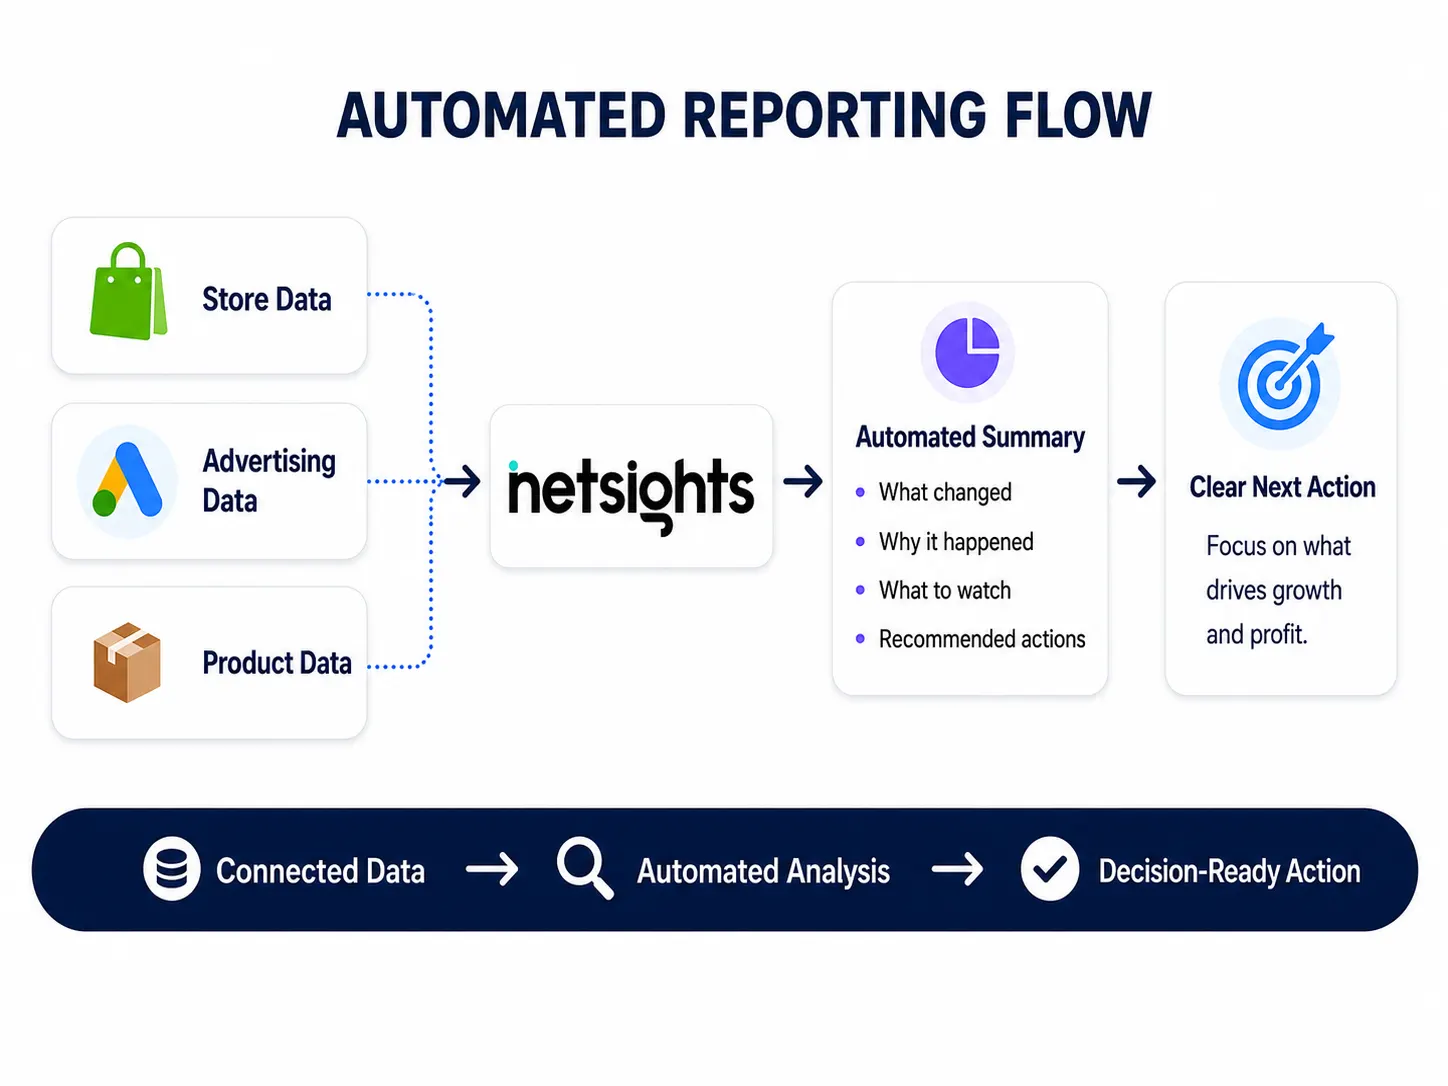
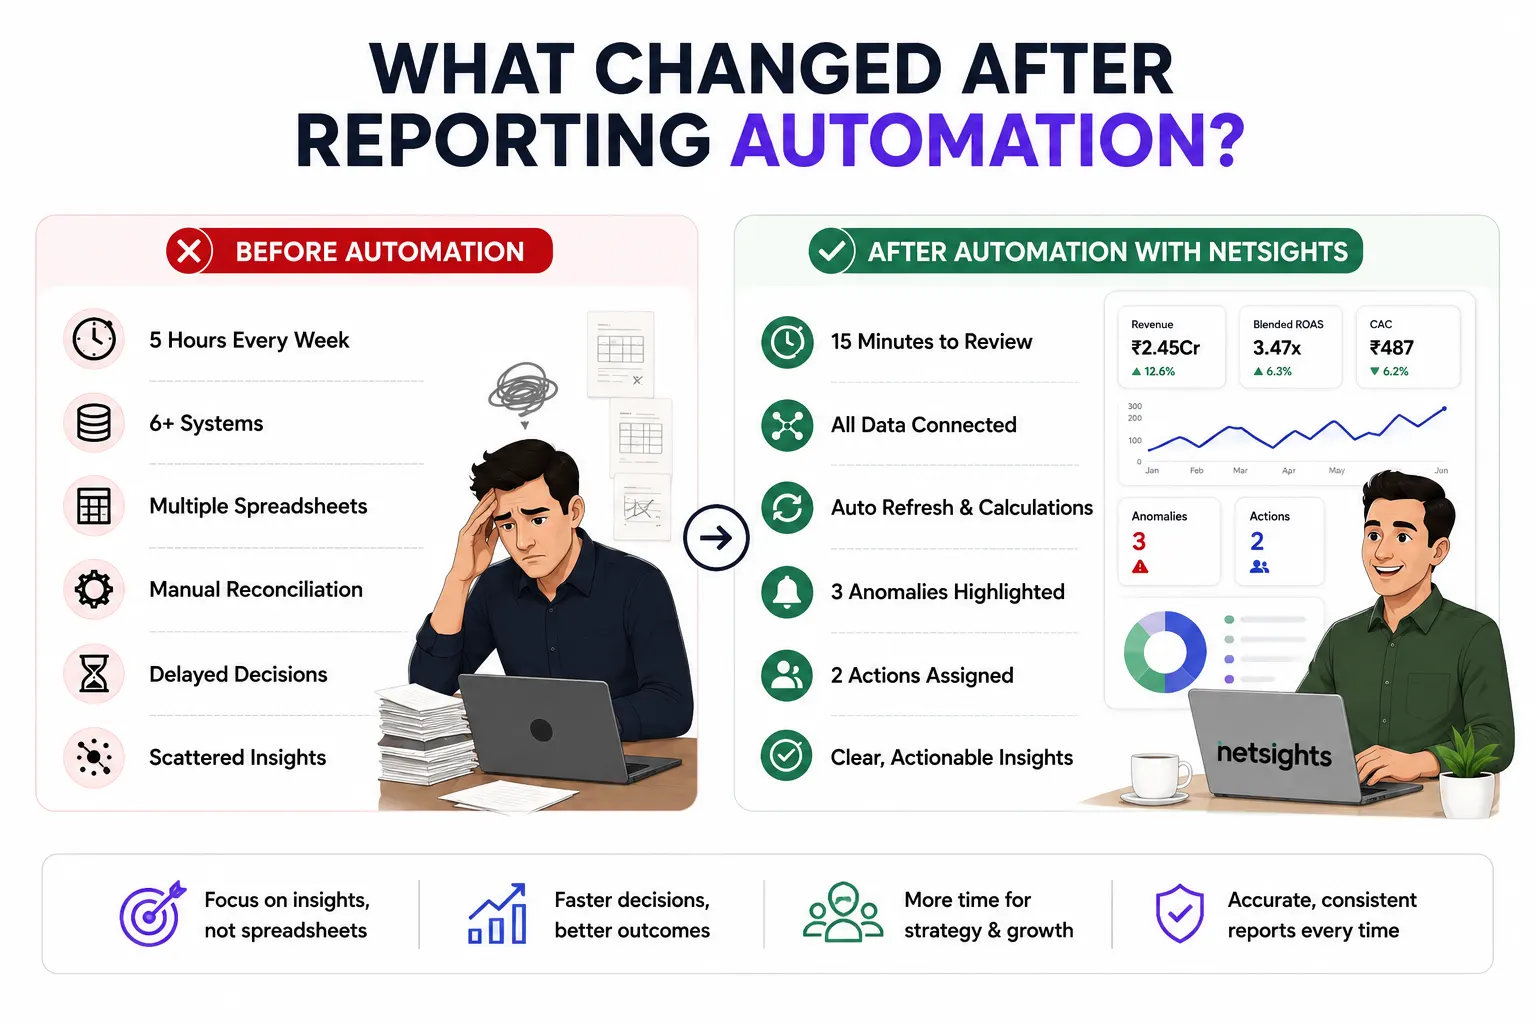
Reporting automation changes the workflow. Rather than rebuilding the same report every week, connected systems collect the approved data, apply consistent KPI definitions, refresh the report and prepare an initial executive summary automatically.
Reducing a five-hour process to fifteen minutes is not guaranteed for every business. The actual saving depends on data quality, reporting complexity and the number of connected systems. However, when most of the five hours are spent exporting files, repairing spreadsheets and formatting reports, automation can remove a substantial amount of repetitive work.
The remaining fifteen minutes can then be used for the tasks that genuinely require human judgement: validating anomalies, understanding their commercial impact and assigning the next action.
From five hours of reporting to fifteen minutes of action.
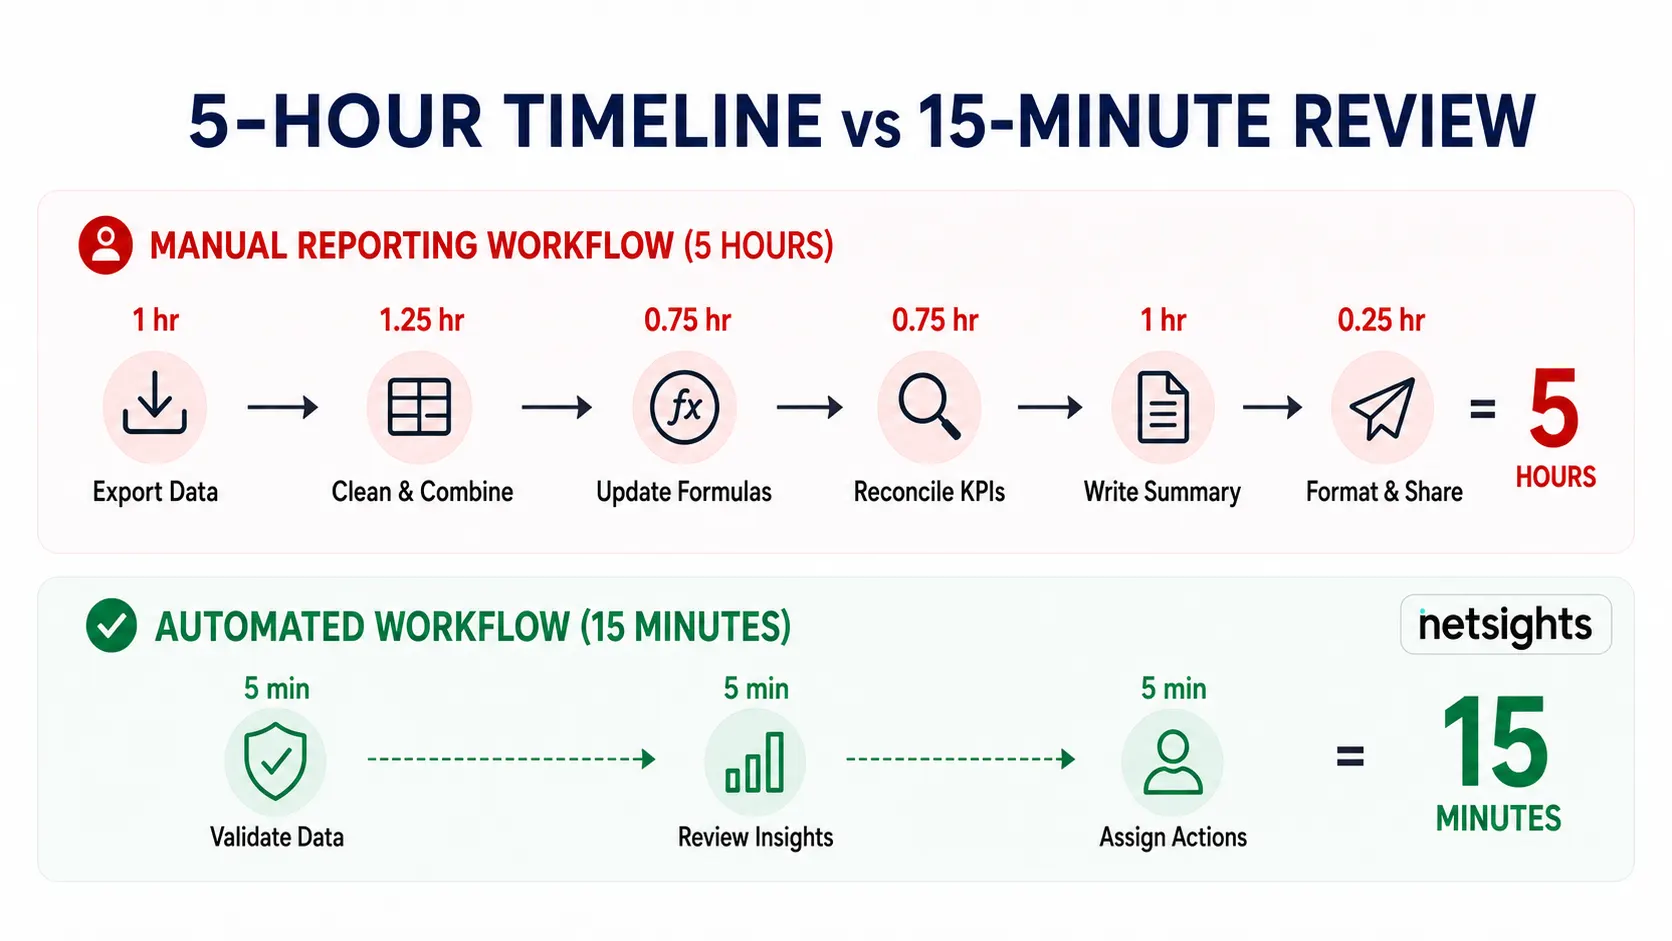
Five hours spent on reporting is not normally done in a single stretch. Rather, it involves numerous smaller tasks that need to be done on a daily or weekly basis.
It takes only a couple of minutes to open a platform. Reporting exports can take a couple more. Spreadsheet formula updates may require ten minutes. Researching why two systems have different numbers for revenue can easily take half an hour.
Done on each data source, store, and reporting period, such smaller tasks become a heavy burden.
The usual ecommerce report will need information such as revenue, orders, website sessions, conversion rate, advertising budget, CAC, ROAS, repeat orders, product performance and inventory information.
In case it is manual, someone has to login to every system and pull out the relevant information using the right date range.
The task takes more time in case the brand runs many stores, in different markets, in different currencies and through various advertising channels. Agencies experience this problem on a much bigger scale since the task has to be done for every single client.
The official documentation of scheduled reports in Google Analytics shows that the standard as well as custom reports can be scheduled on a daily, weekly, monthly or quarterly basis. Google Analytics Data API makes it possible for report data to be extracted programmatically and integrated with other business applications. This demonstrates how recurring extraction needs to be automated and not done manually.
Scheduling data from a single source is great, but a full ecommerce report requires all kinds of performance data to be combined.
Once the exports are ready, the information must be made comparable.
Store revenue needs to be aligned with advertising spend. New-customer orders need to be connected with Customer Acquisition Cost. Campaign performance must be compared with total website conversion, while retention activity must be linked with repeat-customer revenue.
This is where reporting often becomes spreadsheet-heavy.
Teams maintain lookup formulas, manually map campaign names, remove cancelled orders, adjust date formats and reconcile differences between platform-attributed conversions and actual store orders.
A small export change can break the workflow. A renamed campaign can create a duplicate row. A missing product cost can make a profitability calculation unreliable.
The analyst is not interpreting the business yet. The analyst is preparing the information so that interpretation can begin.
An accurate chart is not always useful to a founder.
Leadership needs to know what changed, why the change matters and where the team should focus.
“Revenue increased by 12%” is an update, not an insight.
A more useful summary would explain:
Revenue increased by 12%, but advertising spend grew by 20%. Conversion remained stable and blended CAC increased, suggesting that the additional revenue came from higher acquisition investment rather than improved efficiency.
Producing this explanation manually requires someone to connect revenue, spend, conversion, CAC and customer quality before the meeting can begin.
That interpretation stage is often the final hour in a five-hour reporting workflow.
Ecommerce reporting automation uses connected data sources, standardised KPI calculations and scheduled workflows to collect, process, summarise and distribute recurring performance reports with minimal manual preparation.
The emphasis should be on the complete workflow.
An auto-refreshing dashboard is useful, but it may still leave a founder searching through dozens of charts. The data may be current, yet the interpretation remains manual.
A complete reporting automation workflow should collect approved data, apply the same business calculations during every reporting period, identify meaningful changes and deliver a focused summary to the relevant decision-makers.
The most useful systems add another layer: they help teams determine which performance change deserves attention first.
IBM describes task automation as using technology to complete a task or augment a workflow, particularly when the work is repetitive or time-consuming. Its guidance emphasises that automation can free people to focus on higher-value activities.
Applied to ecommerce reporting, the objective is simple: let software handle repetitive preparation while people retain control over context and business decisions.
This is also the difference between a traditional reporting dashboard and decision-ready ecommerce intelligence.
It can, when most of the original five hours are spent on repeatable work such as extraction, cleaning, reconciliation, formatting and report distribution.
The fifteen-minute figure should be treated as an illustrative target, not a universal promise. A business with several stores, currencies and custom profitability models may need a longer review. A smaller D2C brand with standardised KPIs may achieve the saving more quickly.
The largest improvement comes from changing the team’s role. Instead of constructing the report, the team validates its accuracy and responds to the findings.
Automation does not eliminate human involvement.
The final review should confirm that data connections completed correctly, unusual movements are genuine and the automated interpretation reflects the current business context.
The best place to begin is not the dashboard. It is the decision the report needs to support.
Different people need different reporting views.
A founder wants to know whether the business is growing profitably, where revenue may be leaking and what deserves attention this week. A performance marketer needs deeper acquisition data. A retention manager needs customer cohorts, repeat purchases and lifecycle revenue.
Combining every available metric into one report makes the output harder to read and more difficult to automate.
Start with one question:
What should the reader understand or decide after reviewing this report?
For founder-level reporting, the weekly ecommerce metrics that matter most provide a more useful starting point than copying every number from every platform.
Once the report’s purpose is clear, identify the information needed to answer its central questions.
A profitability report may require revenue, product costs, discounts, returns and advertising spend. An acquisition report may require new-customer orders, spend, conversion rate and contribution margin. A retention report may require customer cohorts, repeat orders and Customer Lifetime Value.
Connecting more data does not automatically create a better report.
The goal is to build a trusted data flow around important business decisions rather than create the largest possible database.
This is the step many teams skip.
Revenue may mean gross sales to one department and net collected revenue to another. CAC may include only advertising spend or all acquisition-related costs. Platform ROAS and blended ROAS may be discussed as though they are interchangeable.
If those definitions remain unclear, automation will simply generate disagreements faster.
| KPI | Definition that must be agreed |
| Revenue | Gross, net or collected revenue |
| New customer | First completed or first paid order |
| CAC | Defined acquisition costs divided by new customers |
| Blended ROAS | Total revenue divided by total advertising spend |
| Conversion rate | Orders divided by sessions or users |
| Repeat Purchase Rate | Customers with multiple orders divided by customers |
| Contribution margin | Revenue after agreed variable costs |
Consistent KPI definitions are also essential for a reliable data-driven growth strategy.
Most reporting teams repeat the same data-cleaning tasks every week.
Common tasks include removing test orders, excluding cancelled orders, converting currencies, standardising date formats, mapping campaign names, and separating new customers from returning customers.
Predictable logic makes such tasks ideal for automation.
Once the rules have been reviewed and approved, they should run automatically whenever new data enters the reporting workflow. The team should not need to recreate formulas or repeat the same cleaning process during every reporting period.
However, every rule must remain transparent and auditable. Anyone reviewing the report should be able to understand why an order was excluded, how the data was adjusted, and how the final KPI was calculated.
A single ecommerce dashboard should not become a wall of disconnected charts.
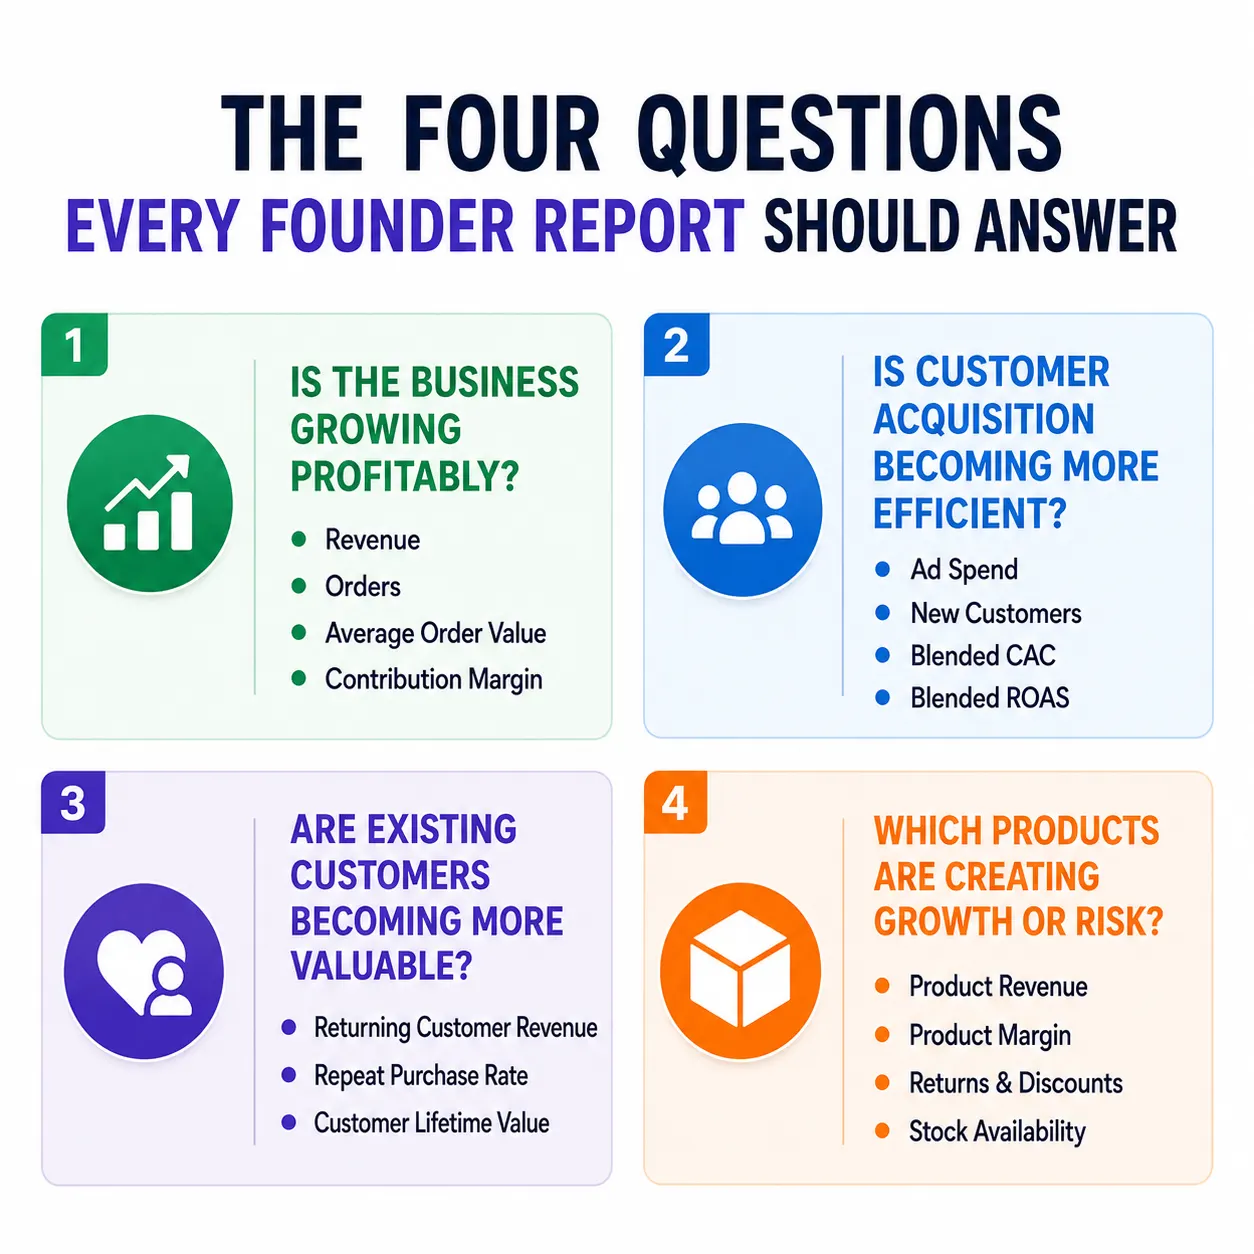
Instead, the founder report should be organised around four clear business questions.
Revenue should be reviewed alongside orders, Average Order Value, gross margin, and contribution margin.
Reviewing these metrics together provides a more accurate view of business performance and prevents topline growth from being mistaken for profitable growth.
Advertising spend, new-customer orders, blended CAC and blended ROAS should be reviewed together.
The report may also include the Customer Acquisition Cost payback period to show how quickly the business recovers its acquisition investment.
New and returning-customer revenue, repeat purchase rate and Customer Lifetime Value reveal whether growth is becoming less dependent on continuous acquisition.
This is why customer retention and customer acquisition should not be treated as unrelated strategies.
Product reporting should connect revenue with margin, discounts, returns and stock availability.
A popular product can still become one of the hidden profit leaks affecting ecommerce growth when associated costs are too high.
Once the data is connected and standardised, AI-powered reporting can prepare a first summary of the most important changes.
A useful automated summary should connect metrics:
Revenue increased by 9%, but advertising spend rose by 16%. Conversion remained stable, while blended CAC increased by 7%. Together, these figures suggest that growth came from higher spending rather than stronger acquisition efficiency.
AI can also flag unusual movements and compare current performance with previous periods, forecasts, or agreed targets.
The broader opportunity is substantial. McKinsey estimated that generative AI and other existing technologies could automate work activities that account for 60% to 70% of employees’ time. Although the estimate applies to many types of work rather than ecommerce reporting alone, it highlights why repetitive analysis and first-draft summaries are well suited to AI assistance.
However, every AI-generated conclusion must remain open to review. A system may identify a relationship between advertising spend and revenue without knowing that the business launched a new collection, entered a new market, tested a campaign, or changed its pricing strategy.
AI should speed up interpretation without claiming to understand business context that has not been provided.
Not every KPI needs to be delivered in real time.
A daily founder brief may include revenue, orders, conversion, spend and major anomalies. A weekly report may focus on trends, commercial risks and team priorities. A monthly review may examine profitability, retention and strategic progress.
Urgent issues such as payment failures, sharp conversion declines or unexpected spending increases may justify immediate alerts.
A gradual fall in repeat purchase behaviour generally needs a more considered weekly or monthly review.
Understanding the difference between real-time business alerts and scheduled reports helps teams stay informed without creating notification fatigue.
The final review should not become a second manual reporting process.
A focused fifteen-minute routine may involve confirming that integrations completed successfully, reviewing the two or three most important changes, validating the automated executive summary and assigning an owner to each next action.
The team is no longer gathering information for the meeting.
It is using the information to move the business forward.
Automate the preparation. Keep your team focused on growth.
Tasks that follow predictable rules are the strongest candidates for automation.
These include data extraction, recurring calculations, reporting-period comparisons, dashboard updates, report formatting, anomaly detection, first-draft summaries and scheduled distribution.
Human judgement remains essential when interpretation depends on business context.
An automated system may identify that blended ROAS declined after an advertising budget increase. A person must determine whether this indicates poor efficiency or an intentional investment in a new market with a longer payback period.
The objective is not to remove people from reporting.
It is to remove the repetitive work that prevents them from thinking.
Consider a D2C brand that uses separate systems for store transactions, website analytics, advertising and customer retention.
Every Monday, an ecommerce manager exports revenue, orders, traffic, conversion, spend, CAC and repeat-purchase figures. The information is copied into a spreadsheet, formulas are checked, charts are updated and a written summary is prepared for the founder.
The complete process takes close to five hours.
After the reporting workflow is automated, the approved sources feed one connected reporting layer. The core KPIs refresh automatically, and the system highlights three meaningful changes:
Revenue increased by 8%. Advertising spend increased by 17%. Returning-customer revenue declined by 6%.
Instead of presenting those as unrelated updates, the automated summary explains that topline growth was largely driven by additional acquisition spending while retention performance weakened.
The ecommerce manager reviews the figures and assigns two actions: investigate campaigns with rising acquisition costs and examine the customer segments that have not reordered.
The visible benefit is the time saved.
The most important benefit is that the team reaches the business decision earlier.
Automating a report nobody finds useful.
Automation does not improve a bloated report.
If the current document contains duplicate charts, unused KPIs and several pages that nobody discusses, automating it simply preserves those weaknesses.
Simplify first. Automate second.
Different systems may use different attribution windows, conversion definitions and processing schedules.
The automated workflow should preserve and explain those differences rather than blending incompatible values into one misleading number.
A notification is useful only when it changes what someone does.
If every normal fluctuation triggers an alert, teams gradually stop paying attention. Poorly designed automation can increase decision fatigue instead of reducing it.
Alerts should be reserved for meaningful, unusual and actionable changes.
Automation can process inaccurate information remarkably efficiently.
Duplicate events, missing costs, broken integrations and inconsistent campaign names will weaken every report built on top of them.
Data-quality checks should be part of the reporting workflow rather than an occasional cleanup exercise.
An insight that has no owner is simply another observation.
Every high-priority alert should lead to a clear next step, responsible person and review date.
Netsights is designed to bring ecommerce, marketing, customer, product and operational performance into one connected intelligence layer.
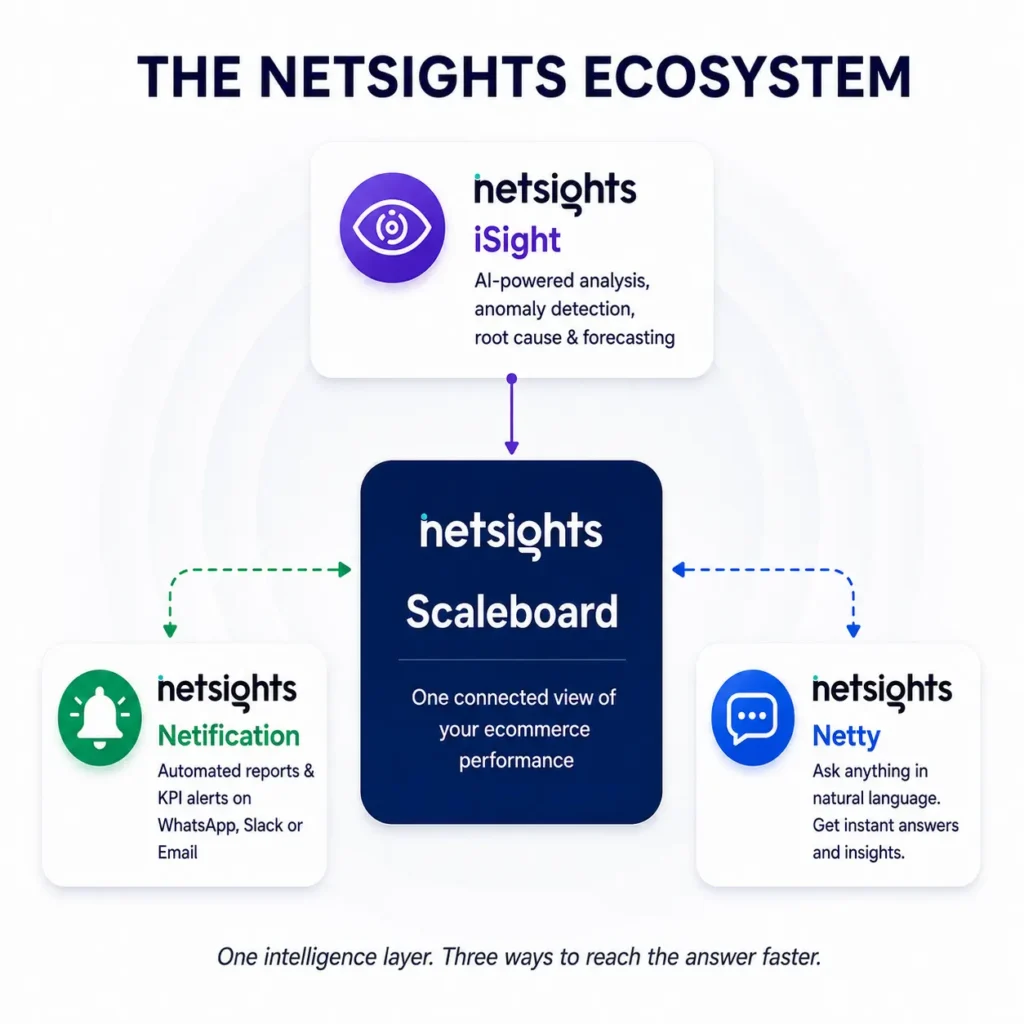
The Netsights Scaleboard goes beyond displaying isolated charts. It is designed to show what changed, add commercial context and help teams identify the next action. Netsights also supports blended metrics and intelligence cards across marketing, products, customers and store performance.
Instead of manually reconciling separate reports, founders and growth teams can review connected signals in one environment.
The Scaleboard is designed around a data-to-diagnosis-to-action flow, helping shorten the distance between noticing a change and understanding why it matters.
iSight is the Netsights revenue-intelligence layer.
It monitors performance metrics, detects anomalies, identifies likely root causes, supports forecasting and recommends possible actions. Rather than simply stating that a KPI moved, iSight is designed to connect that movement with surrounding business signals.
Netification delivers daily reports and KPI alerts through WhatsApp, Slack or email. It can surface metrics including revenue, Average Order Value, blended ROAS, traffic, orders, ad spend, conversion rate and product performance. Teams can also configure rules and thresholds around the changes they want monitored.
Netty gives users a conversational way to access business performance intelligence.
Rather than searching through several reports, founders can ask natural-language questions about revenue, campaigns, targets or performance changes. Netsights positions this conversational layer as a way to reduce the friction between identifying a question and finding the relevant analysis.
Together, these capabilities help ecommerce teams move beyond reporting automation towards ecommerce decision intelligence.
Spend fifteen minutes reviewing performance, not five hours preparing it.
The visible problem with manual ecommerce reporting is the amount of time it consumes.
Hours are lost exporting files, updating spreadsheets, checking formulas, formatting charts and writing summaries.
The deeper problem is the delay between a performance change and the decision required to address it.
Effective reporting automation removes repetitive preparation, standardises calculations, consolidates cross-channel data and prepares a clearer explanation of what changed.
It does not remove people from the reporting process.
It gives them more time to investigate the right problem, assign the right action and measure whether the decision worked.
That is the real value of reducing a five-hour process to fifteen minutes. The business does not simply receive its report earlier.
It reaches the decision earlier.
A: Ecommerce reporting automation collects, calculates, summarises and distributes recurring performance data from connected ecommerce systems with minimal manual work.
A: Businesses can reduce reporting time by connecting data sources, standardising KPI definitions, automating recurring calculations and scheduling report delivery.
A: Yes. AI can identify KPI movements, flag anomalies and prepare an executive summary, but the final interpretation should still receive human review.
A: Founder summaries, marketing-performance reports, sales reports, retention reports, inventory updates and recurring KPI alerts are strong candidates for automation.
A: Automated reporting can reduce the need to check several dashboards, but detailed analytical views may still be required when investigating a specific issue.
A: Netsights connects ecommerce performance data and provides automated reports, KPI alerts, anomaly detection and conversational analysis through Scaleboard, iSight, Netification and Netty.
We write about growth, retention, and the numbers that actually predict what happens next for D2C brands. Have a topic you'd like us to cover? Get in touch .
Your ecommerce store already contains the answers. Learn how AI ecommerce analytics helps founders ask business questions, understand what changed and why, and move from scattered data to clearer decisions.
Your ecommerce store already contains the answers. Learn how AI ecommerce analytics helps founders ask business questions, understand what changed and why, and move from scattered data to clearer decisions.

Your ecommerce store already contains the answers. Learn how AI ecommerce analytics helps founders ask business questions, understand what changed and why, and move from scattered data to clearer decisions.