
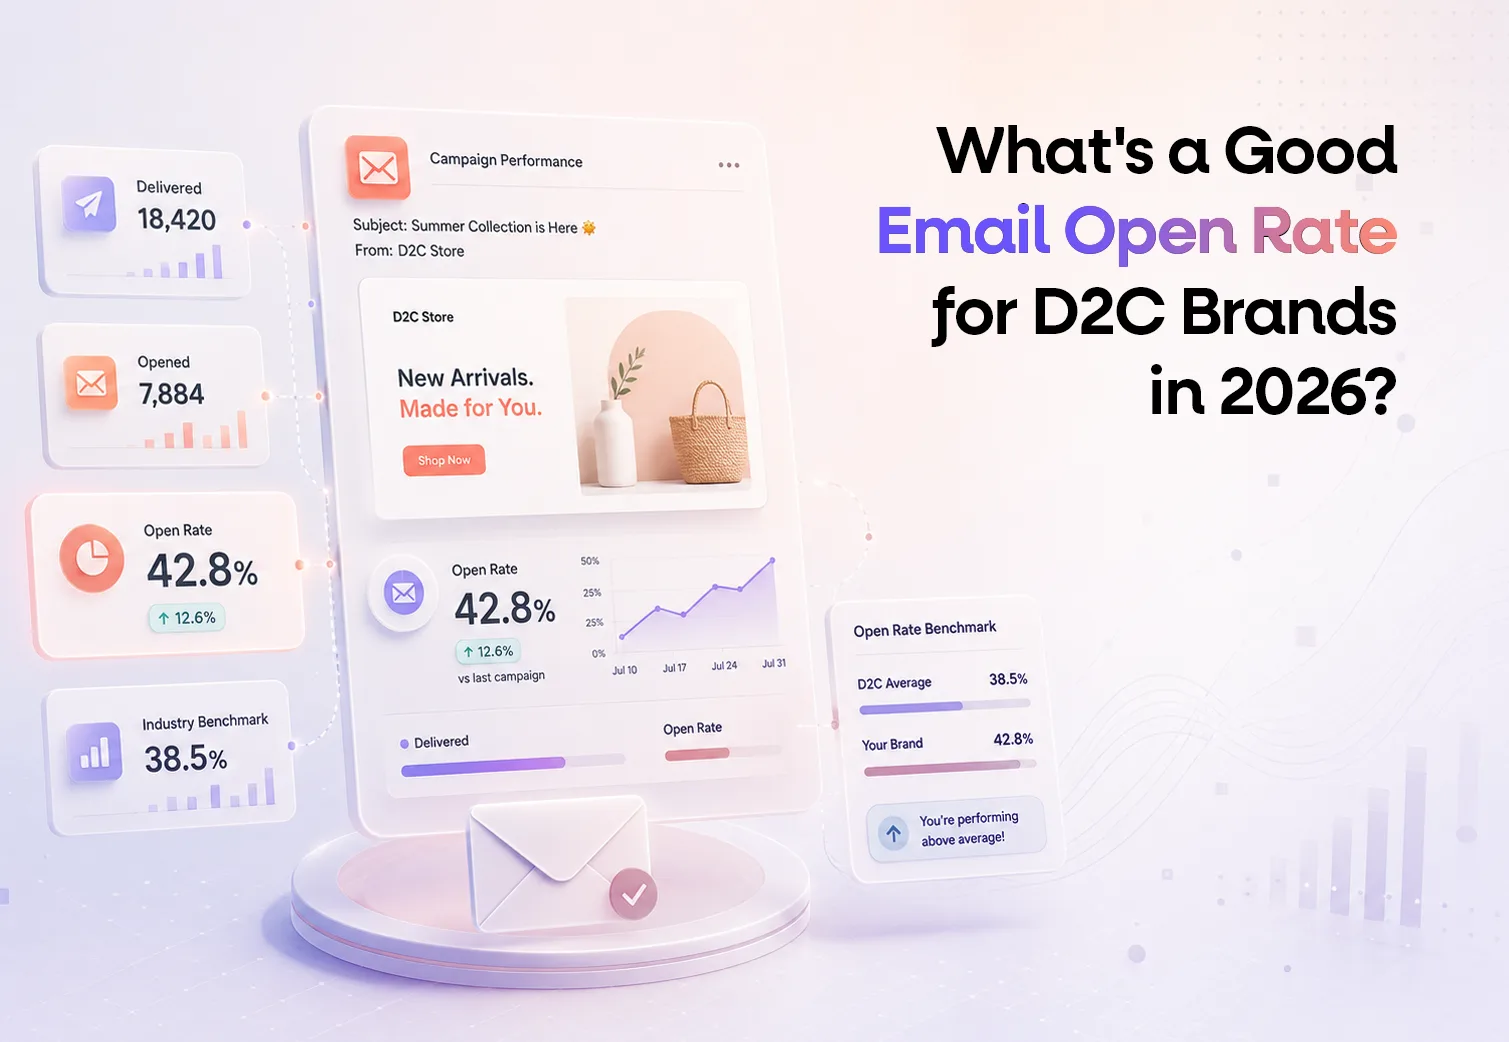
Open rates tell you who looked. Connected data tells you what to do next.
Your latest email campaign achieved a 31% open rate. Should your team celebrate, investigate or change the strategy?
For most ecommerce businesses, a good email open rate for D2C brands in 2026 is approximately 30% to 35% for regular marketing campaigns. Results above 35% generally indicate strong engagement, while highly targeted emails and behaviour-triggered automations may perform considerably better.
However, open rate alone cannot tell you whether an email campaign was commercially successful.
A campaign with a 40% open rate may generate very few clicks or purchases. Another campaign with a 29% open rate could deliver significantly more revenue because it reached customers with stronger purchase intent.
The real question is not simply whether customers opened the email. It is whether the campaign moved them closer to a purchase, repeat order or long-term relationship with the brand.
This guide explains the current D2C email open rate benchmark, how performance changes across industries and campaign types, why open rates decline and how brands can connect email engagement with clicks, conversions and revenue.
Email open rate is the percentage of successfully delivered emails that an email platform records as opened.
The standard email open rate formula is:
Unique email opens ÷ Successfully delivered emails × 100
Consider a skincare brand that sends a campaign to 25,000 subscribers. If 24,000 messages are successfully delivered and the platform records 7,440 unique opens, the calculation is:
7,440 ÷ 24,000 × 100 = 31%
The reported email open rate is therefore 31%.
A unique email open rate counts each recipient only once, even when that person opens the message several times. A total open rate includes repeat opens and can make engagement appear higher than it was.
Open rate should also be calculated using delivered emails rather than the total number sent. Subscribers whose emails bounced never had the opportunity to open the message.
The metric mainly helps marketers evaluate whether the sender name, subject line, preview text, timing and inbox placement were strong enough to earn initial attention. It does not show whether the recipient read the complete email, clicked a product or completed a purchase.
Recent ecommerce datasets place the average campaign email open rate at approximately 30%.
Omnisend analysed more than 20 billion campaign emails sent by over 27,000 brands and reported an overall open rate of approximately 30.22%. Klaviyo’s 2026 benchmark analysis, based on more than 183,000 brands, also places the average campaign open rate close to 31%.
These results provide a useful starting framework:
Email open rate | Practical interpretation |
Below 20% | A possible deliverability, targeting or list-quality problem |
20%–25% | Below average for many ecommerce brands |
25%–30% | Acceptable, but with clear improvement potential |
30%–35% | Healthy performance for regular D2C campaigns |
35%–45% | Strong audience engagement |
Above 45% | Excellent performance or a highly targeted message |
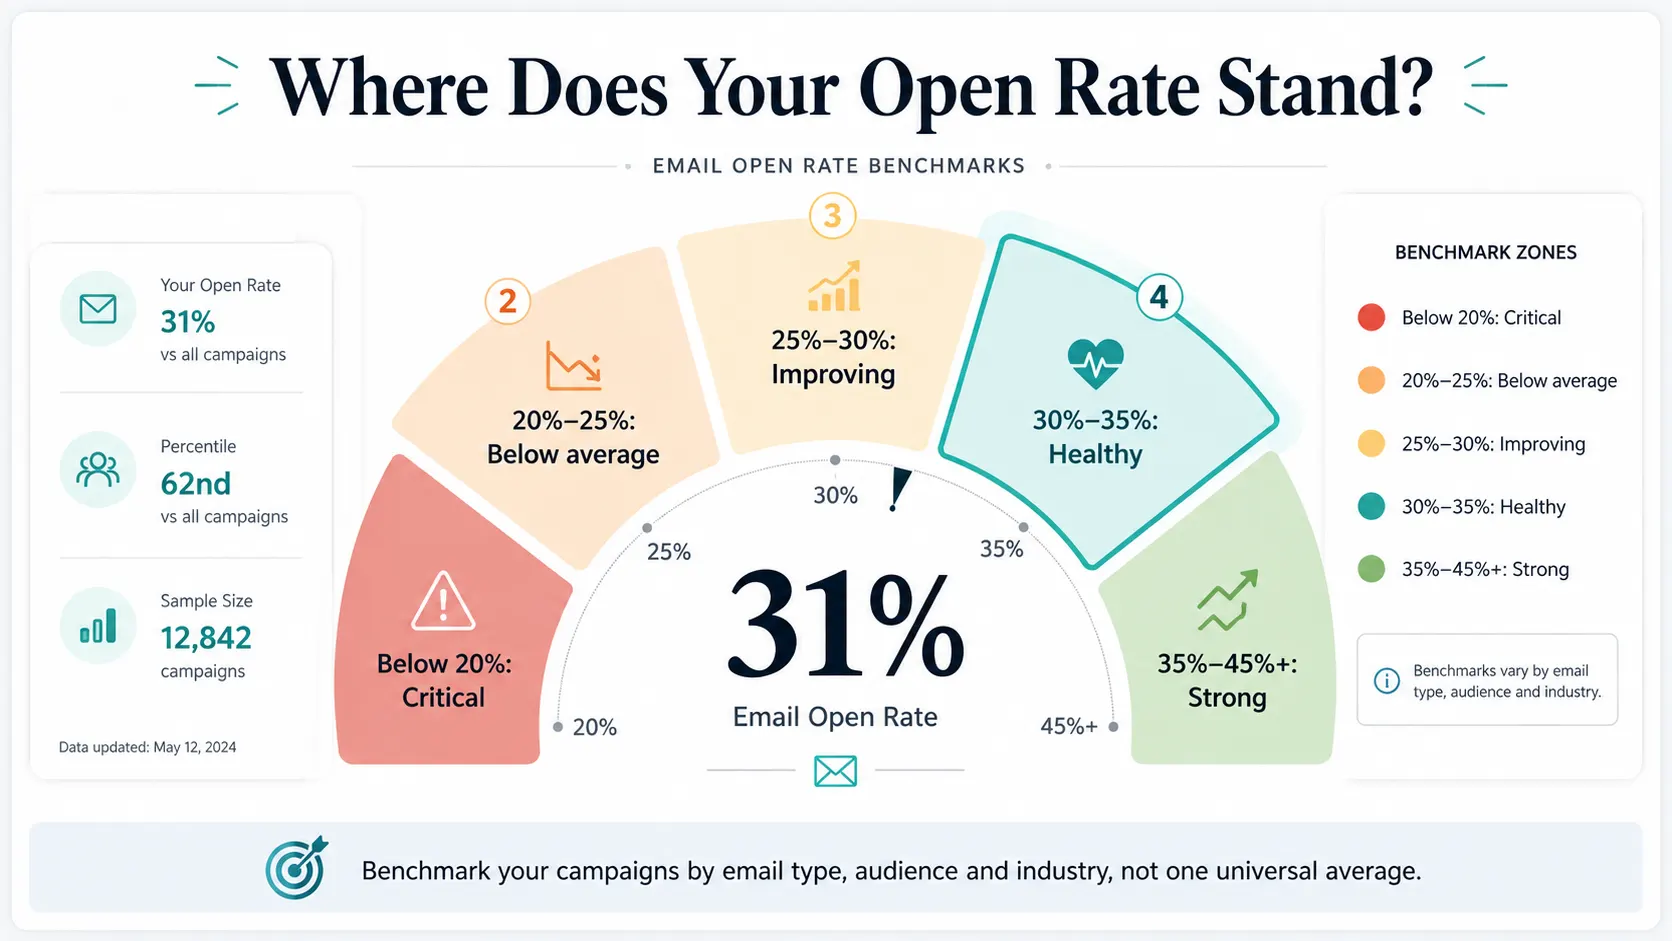
These ranges should be used as directional benchmarks rather than universal grades.
A newsletter sent to the full database should not be compared with a back-in-stock alert sent to customers waiting for one product. Similarly, an order confirmation will naturally receive more attention than a general collection announcement.
The more meaningful question is:
Is this email open rate strong for this audience, campaign type, customer stage and business objective?
This is where ecommerce decision intelligence becomes more valuable than surface-level reporting. The metric tells you what changed. Connected analysis helps reveal why it changed and whether the result requires action.
Your open rate changed. Do you know what caused it?
Connect email engagement with revenue, customer behaviour and campaign performance.
Industry averages are useful for context, but they should not replace your own historical baseline.
Suppose your brand usually achieves a 34% campaign open rate. If it suddenly falls to 26%, the campaign may require attention even though 26% remains close to an acceptable industry range.
The opposite is also true. A brand that previously averaged 21% and improves to 28% has made meaningful progress, even if it has not yet reached the broader benchmark.
Brands should compare performance across similar conditions. A product launch should be compared with previous product launches. A welcome email should be compared with earlier welcome emails. A campaign sent to recently engaged subscribers should not be compared with one sent to a broad, partially inactive database.
Historical comparison helps teams separate a genuine decline from normal variation.
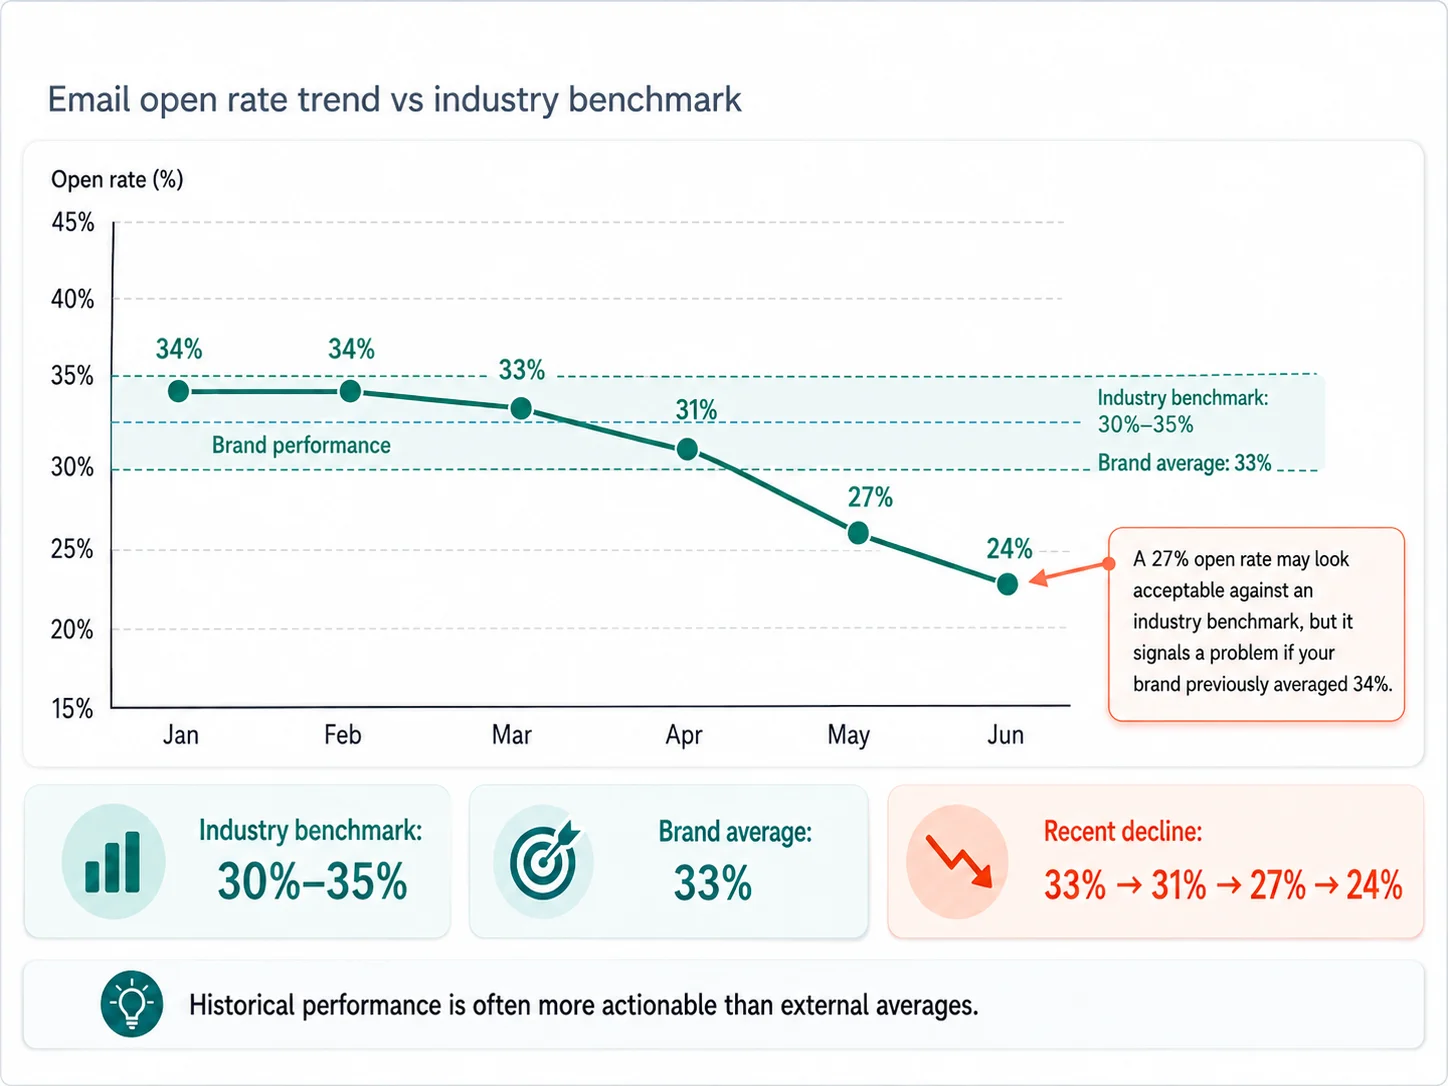
It also prevents marketers from reacting to every small movement. If an open rate changes from 31.4% to 30.9%, the difference may not require a strategic overhaul. A consistent downward trend across several campaigns is much more significant.
Benchmarks show where you stand. Your own trends show where the problem started.
Track meaningful changes before they become long-term performance declines.
Email engagement varies by industry because customers have different buying cycles, product relationships and reasons for opening.
According to Omnisend’s current industry data, apparel campaigns averaged a 31.10% open rate, toys and hobbies reached 30.66%, home and garden recorded 30.60%, food and drink reached 30.03%, beauty and fitness recorded 29.33%, and consumer electronics averaged 25.70%.
A good email open rate for fashion brands may therefore fall between 31% and 35%. Fashion shoppers may respond well to new collections, limited sizes, early access and back-in-stock alerts.
For beauty brands, a rate near 29% to 33% can be competitive. Engagement may improve when emails reflect skin concerns, routines, ingredients or expected replenishment periods.
Food and beverage brands can use consumption cycles to time repeat-purchase reminders. A customer who usually reorders coffee every four weeks is more likely to respond to a timely reminder than a generic weekly promotion.
There is no single universal Shopify email open rate benchmark because Shopify stores operate across many industries. A Shopify fashion brand should compare itself with fashion businesses, while a Shopify food brand should use food and beverage benchmarks.
The ecommerce platform matters less than the quality of the audience, relevance of the message and timing of the campaign.
Campaign type is one of the most important factors affecting open rate.
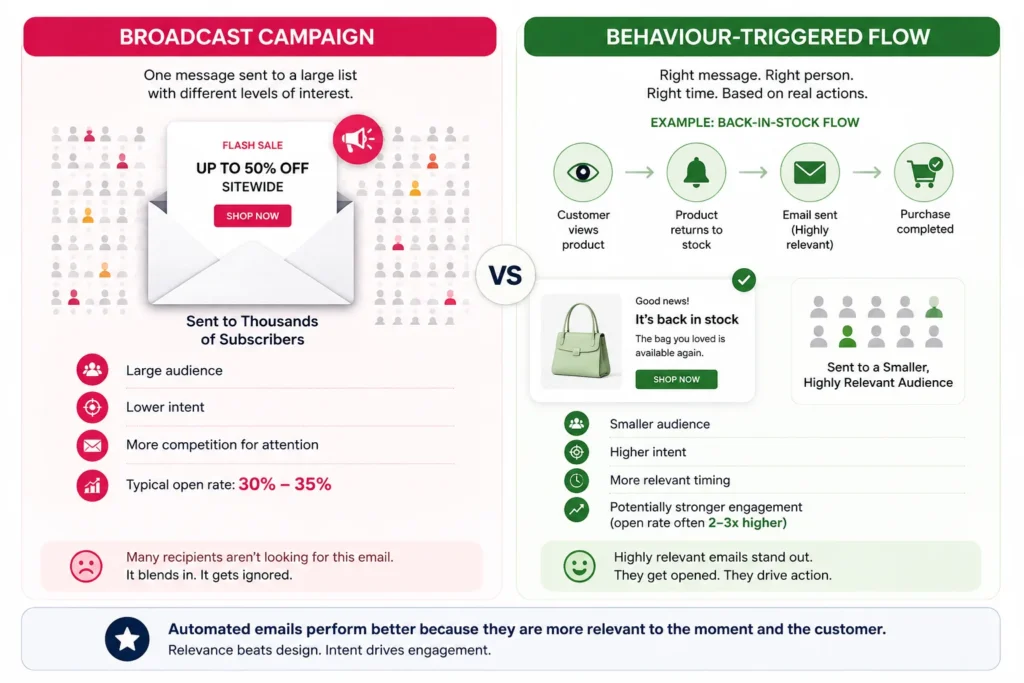
A broad promotional campaign reaches customers whether or not they currently intend to buy. An automated email is usually triggered by a specific action, such as joining the list, viewing a product or leaving an item in the basket.
That difference in intent changes performance.
Promotional emails include newsletters, new product launches, season offers, sales information, and collection drives.
Such emails are usually sent to bigger audiences and could even be sent multiple times during a week. A 30%-35% open rate is indicative of good performance for such emails.
Performance would tend to decrease because all campaigns are sent out to the entire list. The subscriber that is interested in skincare might keep getting irrelevant emails about make up. The consumer who purchases products only at full price might get too many discount emails.
Welcome emails reach subscribers immediately after they join the database, when their interest is relatively high.
The first welcome message should explain what makes the brand different, introduce suitable products and help the subscriber choose a logical next step. It should not rely entirely on a discount code.
A beauty brand could ask new subscribers whether they are interested in hydration, acne care or anti-ageing products. Future messages could then reflect that preference.
This turns a generic welcome series into the beginning of a personalised customer journey.
Abandoned cart emails target customers who have already picked up the product but haven’t checked out.
In general, the abandoned cart email should outperform general marketing email as there has been a proof of purchase intention.
Poor open rate for abandoned carts might be caused by the fact that the reminder was sent too late, the sender isn’t recognizable or the subject isn’t relevant.
Instead of sending the following generic reminder, you can try a different approach:
You forgot your linen shirt in size M
Here, it becomes much easier for the customer to understand why they should open the email.
Order confirmations, shipping updates and delivery notifications often record very high open rates because customers actively expect them.
The customer is checking whether payment succeeded, when the order will arrive or whether the delivery address is correct.
These emails can include relevant product-care information or recommendations, but their performance should not be compared with newsletters or sale campaigns. The customer motivation is fundamentally different.
Email open rate remains useful in 2026, but it is not a precise measurement of human attention.
Most email marketing platforms track opens through a small image pixel. When the image loads, the platform records an open.
Apple Mail Privacy Protection hides users’ IP addresses and prevents senders from reliably identifying whether recipients opened their emails. This can create recorded opens that do not represent genuine reading behaviour.
Privacy protection can also affect location assumptions, open-time reporting, engagement scoring and automations triggered by opens.
Security tools create another complication. Some systems inspect links or load content before a person interacts with the email. At the same time, image blocking can prevent a genuine reader from being recorded as an opener.
For this reason, brands should treat open rate as a directional engagement signal rather than an exact statement of customer behaviour.
A stronger definition of an engaged subscriber should consider recent clicks, website visits, product views, cart activity and purchases alongside recorded opens.
An opening is only the first visible step in the customer journey.
A complete email journey looks more like this:
Delivered → Opened → Clicked → Visited → Purchased → Reordered
Each stage answers a different performance question.
Open rate shows whether the sender name and subject line earned initial attention. Click-through rate shows whether the email content persuaded recipients to act. Conversion rate reveals whether the website and offer completed the journey.
Revenue per recipient then shows how much commercial value the campaign generated for each person reached.
Consider two hypothetical campaigns:
| Metric | Campaign A | Campaign B |
| Open rate | 41% | 30% |
| Click rate | 0.7% | 2.8% |
| Placed order rate | 0.05% | 0.36% |
| Revenue per recipient | £0.11 | £0.79 |
Campaign A appears stronger when viewed through open rate alone. Campaign B is clearly more valuable to the business.
This is why email performance should be connected with DTC unit economics, including contribution margin, repeat purchase behaviour and customer lifetime value.
Email can also increase the long-term value of customers acquired through paid media. Understanding the balance between customer retention and customer acquisition helps brands evaluate email as a profit and retention channel rather than only a campaign channel.
A low open rate is a symptom. It is not a complete diagnosis.
Before changing creative or increasing discounts, examine how open rate behaves alongside other metrics.
| Performance pattern | Most likely area to investigate |
| Low opens and low clicks | Deliverability, sender recognition, segmentation or subject lines |
| High opens and low clicks | Email content, product selection, offer or CTA |
| High clicks and low orders | Landing page, stock, price or checkout experience |
| Stable opens and falling revenue | AOV, conversion, margins or product availability |
| Falling opens across every campaign | List fatigue, sending frequency or sender reputation |
| Weak campaigns but strong automations | Broadcast strategy and audience segmentation |
Suppose a fashion brand’s average open rate falls from 34% to 24% over six weeks.
If the decline affects newsletters, launches and sale campaigns, one weak subject line is unlikely to be the cause. The team should investigate whether sending frequency increased, inactive subscribers were added to the audience or inbox placement deteriorated.
If open rates remain healthy but clicks fall, deliverability is probably not the primary issue. The email may be too crowded, the offer may lack clarity or the products may not match the audience.
This connected approach helps teams stop drowning in ecommerce data and start making decisions based on causes rather than symptoms.
Diagnose the broken stage before changing the campaign.
Find out whether the real issue is deliverability, engagement, conversion or customer retention.
Even an excellent subject line cannot work if the email does not reach the inbox.
Google’s email sender guidelines require authentication and introduce additional requirements for bulk senders, including SPF, DKIM, DMARC and one-click unsubscribe for promotional messages. Google also advises senders to keep spam rates below 0.1% and avoid reaching 0.3% or higher.
SPF identifies which servers are authorised to send email for the domain. DKIM adds a cryptographic signature to verify the message. DMARC tells receiving providers how to handle emails that fail authentication.
These measures cannot guarantee inbox placement, but they reduce preventable authentication and reputation problems.
Brands should also monitor bounce rates, complaint rates, unusual sending-volume increases and Gmail Postmaster Tools.
Making unsubscribe options easy to find can protect sender reputation. Losing an uninterested subscriber is less damaging than encouraging that person to mark the email as spam.
Improving open rate begins with recognition, relevance and trust.
The sender name should be consistent and immediately associated with the brand. Customers may ignore messages when the name is unfamiliar or changes frequently.
Subject lines should communicate a clear reason to open. A specific benefit, product update or relevant customer signal often performs better than vague curiosity.
For example:
Generic: Something exciting has arrived
Relevant: The moisturiser you viewed is back in stock
Preview text should extend the subject line rather than repeat it.
Subject: Your skincare routine may be running low
Preview text: Reorder your usual products before you run out.
Personalisation should also go beyond inserting a first name. Browsing history, purchase category, product size, loyalty level and replenishment timing create more meaningful relevance.
Testing remains important, but brands should test one major variable at a time. If the sender name, subject line, offer and send time all change together, the team cannot identify what caused the result.
The winning variation should also be judged using clicks, conversions and revenue where possible. A subject line that produces more openings but fewer purchases may not be the real winner.
The most effective segmentation reflects what customers have done, not only who they are.
A fashion brand could distinguish between customers interested in ethnic wear, office clothing and casual collections. A food brand could group customers by typical reorder period. A beauty brand could segment according to skin concern or product routine.
Behavioral segmentation can also identify full-price buyers, promotion-sensitive shoppers, recent purchasers and high-value repeat customers.
Each group may require a different message.
Sending a large discount to a loyal full-price customer may reduce margin unnecessarily. Sending the same product recommendation to every subscriber may reduce relevance.
This is why a data-driven ecommerce growth strategy should connect customer behaviour with specific marketing actions rather than produce more reports.
Automated flows reach customers in response to actions and lifecycle moments.
Important journeys include welcome, browse abandonment, cart recovery, post-purchase education, replenishment, back-in-stock and win-back campaigns.
Klaviyo’s 2026 benchmark data shows that flows generate nearly 41% of total email revenue from only 5.3% of sends. The same report found that flows achieved more than three times the click rate and thirteen times the placed order rate of campaigns.
These results demonstrate why timing and intent often matter more than sending volume.
A replenishment email sent when the customer is likely to run out of a product can feel helpful. The same message sent two days after purchase would feel irrelevant.
Automation is therefore not simply about sending emails without manual work. It is about delivering communication when the customer has a logical reason to engage.
Consider a fashion brand that records a 37% open rate but only a 0.7% click rate on a new collection campaign.
The sender name and subject line generated attention, but the email did not convert that attention into product interest. The problem may be weak merchandising, too many products, unclear visual hierarchy or a landing page that does not match the campaign promise.
Now consider a food brand with a 29% open rate and a strong repeat-order rate on a replenishment reminder.
The open rate is close to average, but the campaign succeeds commercially because it reaches the right customers at the right time.
A third brand may maintain strong opens and clicks while email-attributed profit declines. The underlying cause could be heavier discounting, lower AOV, higher returns or low-margin products receiving most of the exposure.
Email metrics should therefore be evaluated alongside the weekly ecommerce metrics founders should monitor and the hidden profit leaks affecting ecommerce profitability.
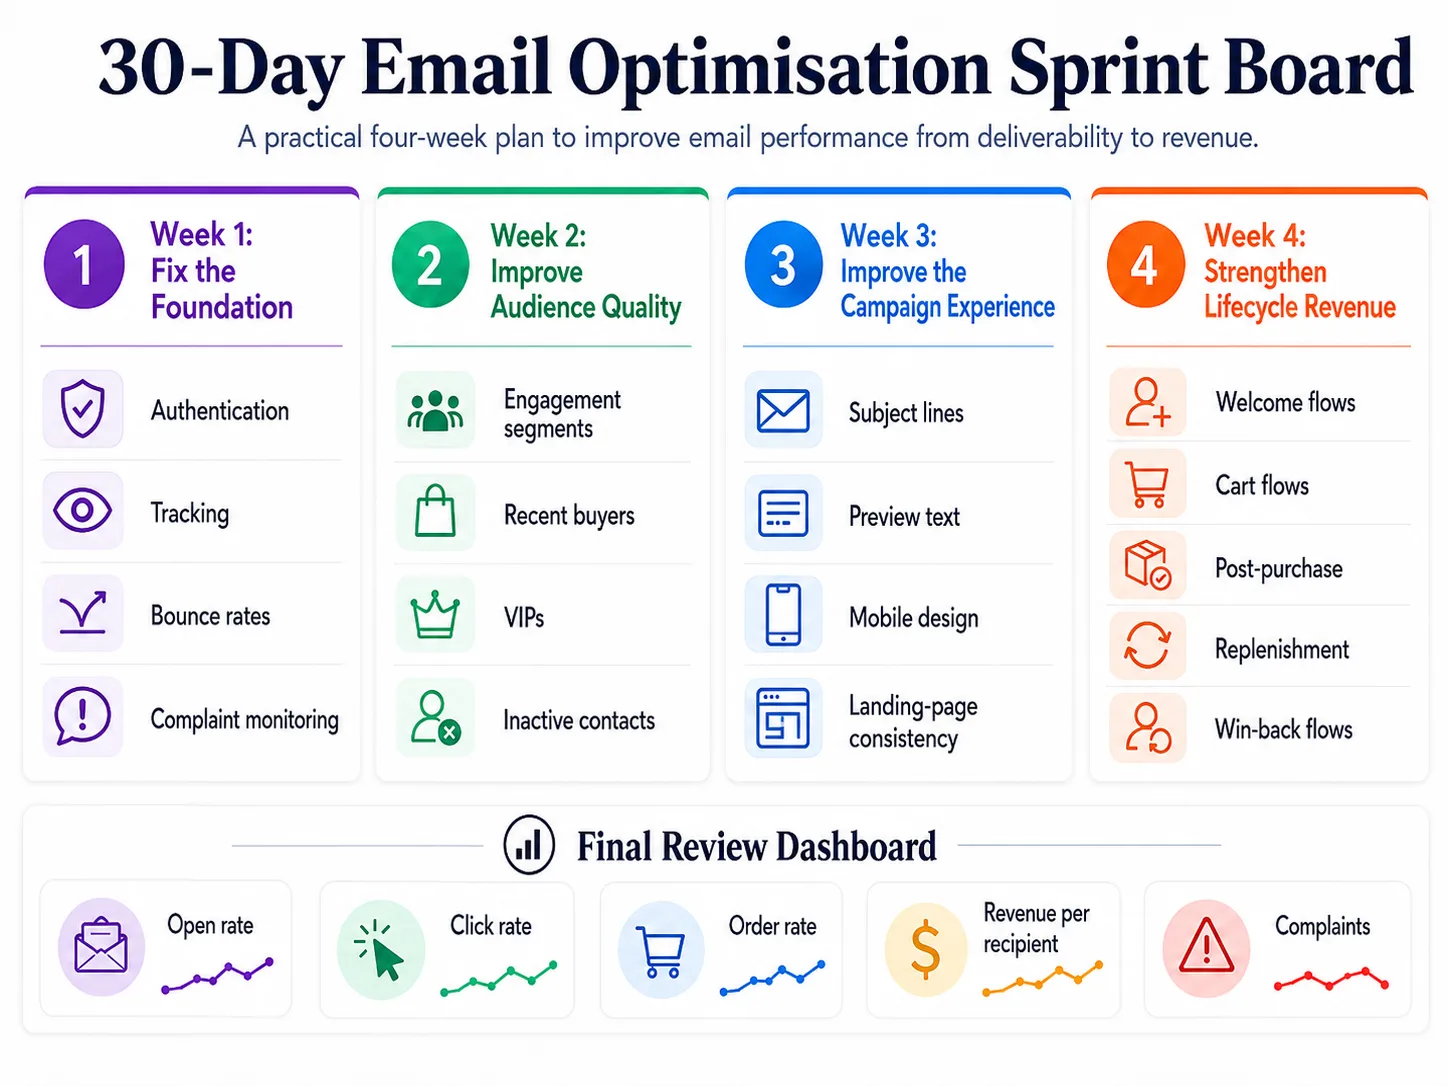
Start by checking tracking accuracy and deliverability. Review authentication, bounce rates, spam complaints and attribution settings, and separate promotional campaigns from automated flows so their performance is not compared incorrectly.
Next, reorganise the audience into meaningful segments. Group engaged subscribers, recent purchasers, repeat customers, category-specific audiences and long-term inactive contacts to improve relevance.
The third stage should focus on campaign execution. Test clearer subject lines, stronger preview text, simpler mobile layouts and more focused CTAs. Make sure the landing page continues the promise made in the email.
In the final week, assess lifecycle automation. Review welcome, abandonment, post-purchase, replenishment and win-back journeys for timing, relevance and conversion performance.
Once the month ends, compare open rate with click rate, conversion rate, placed order rate, revenue per recipient, unsubscribe rate and spam complaint rate.
The goal is not simply to record more openings. It is to strengthen the entire journey from inbox attention to profitable customer action.
Ready to put the 30-day plan into action?
Bring campaign, customer and revenue signals together in one decision-focused view.
Email performance rarely exists in one platform.
Campaign data may sit in Klaviyo, Mailchimp, Omnisend or Netcore. Orders and customer information sit in Shopify or WooCommerce. Website behaviour sits in GA4. Advertising costs sit in Meta Ads and Google Ads.
When these platforms are reviewed separately, the team may know that open rate declined without understanding whether customer retention, conversion or profitability changed at the same time.
NetSights helps ecommerce teams connect data across revenue, marketing, operations and inventory so leadership teams can move from scattered reporting to clearer action.
iSight supports faster revenue and growth analysis, while Netification helps teams receive important performance updates without continuously checking dashboards.
The goal is not another set of charts. It is to answer more useful questions:
Did email revenue fall because fewer customers opened, fewer openers clicked, website conversion declined or repeat purchase behaviour weakened?
A good email open rate for D2C brands in 2026 is generally around 30% to 35% for regular campaigns. Rates above 35% indicate strong engagement, while behaviour-triggered emails may perform significantly better.
But reaching the benchmark is not the final goal.
A high open rate does not guarantee clicks. More clicks do not automatically create orders. More orders do not always produce sustainable profit.
The strongest D2C brands evaluate the complete journey:
Delivered → Opened → Clicked → Purchased → Reordered
They use open rate to identify early engagement, then connect it with conversion, revenue, retention and customer lifetime value.
NetSights helps ecommerce teams understand those relationships, identify meaningful changes and focus on actions that can improve business performance.
iSight is positioned as an AI-powered revenue-intelligence engine that monitors performance metrics, detects anomalies, identifies root causes, forecasts revenue and recommends actions.
Within a profitability audit, this type of analysis can help teams move from observing that a metric changed to investigating the connected drivers.
For example, a decline in revenue may coincide with rising CAC, lower conversion and reduced availability of a high-contribution product. Reviewing those signals together creates a better starting point than reacting to the revenue figure alone.
Netification provides automated ecommerce KPI updates and alerts through channels such as WhatsApp and email. The objective is to surface material performance changes without requiring teams to inspect multiple dashboards throughout the day.
This is particularly relevant to profitability monitoring because the cost of a leak often increases with time. A campaign overspending for one day is less damaging than the same issue running unnoticed for three weeks.
Netty adds a conversational route to business analysis. Instead of searching reports manually, teams can ask questions about performance and use the resulting context to begin an investigation.
Conversational analysis does not replace financial judgment or operator experience. Its value lies in reducing the friction between noticing a problem and exploring the relevant data.
The broader goal is not to automate every decision. It is to give founders and growth teams a clearer, faster view of the issues that deserve human attention.
McKinsey reported in 2026 that its own Merchant AI Accelerator had seen gross-margin improvements of approximately two to three percentage points in participating implementations. That is a consulting-reported outcome rather than a universal benchmark, but it illustrates the potential value of combining data, technology and operating processes to improve commercial decision-making.
Know what changed. Understand why it matters. Act before revenue slips.
A: A good email open rate for most regular D2C campaigns in 2026 is approximately 30% to 35%. Highly targeted messages and automated emails can perform considerably better
A: A 20% open rate is below average for many ecommerce categories. The brand should review inbox placement, sender reputation, segmentation, subject lines and list quality
A: Yes. A 30% email open rate is broadly healthy for a standard Shopify campaign. The result should still be compared with the store’s industry, campaign type and historical performance
A: A sudden decline may be caused by weaker deliverability, increased campaign frequency, inactive subscribers, poor audience targeting, an unfamiliar sender name or a change in message relevance
A: Privacy tools, automatic image loading, security scanners and image blocking can create recorded opens that do not represent actual reading behaviour, or prevent genuine opens from being recorded
A: Brands should monitor click-through rate, conversion rate, placed order rate, revenue per recipient, repeat purchase rate, unsubscribe rate and spam complaint rate
A: Brands should first run a re-engagement campaign and review clicks, website activity and purchase history. Persistently inactive or invalid contacts can then be suppressed to protect list health
A: There is no universal frequency. Highly engaged subscribers can receive more frequent communication, while less-engaged contacts should receive fewer, more relevant campaigns
We write about growth, retention, and the numbers that actually predict what happens next for D2C brands. Have a topic you'd like us to cover? Get in touch .
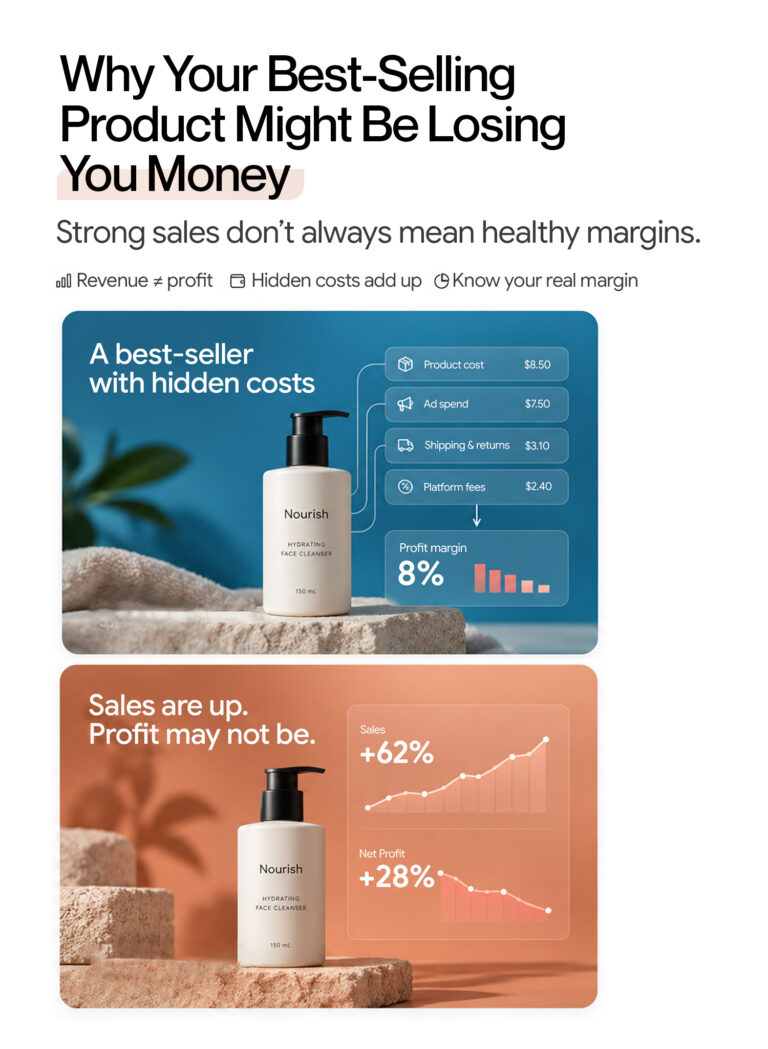
A product can be a best performer in your sales charts and still money is lost on each order. Product profitability shows what is left after deducting product costs, discounts, shipping, ads, and returns. Here’s how to analyze the gap between strong sales and healthy profit, and what to do about it. Every Monday, Alisha […]
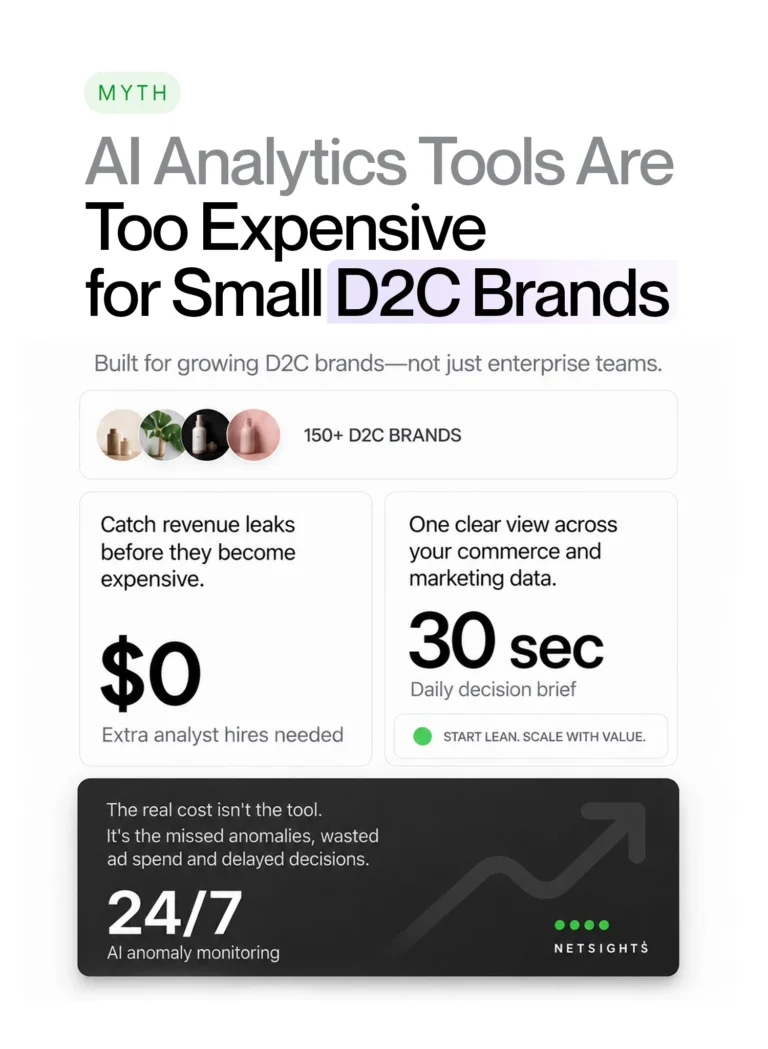
Your ecommerce store already contains the answers. Learn how AI ecommerce analytics helps founders ask business questions, understand what changed and why, and move from scattered data to clearer decisions.
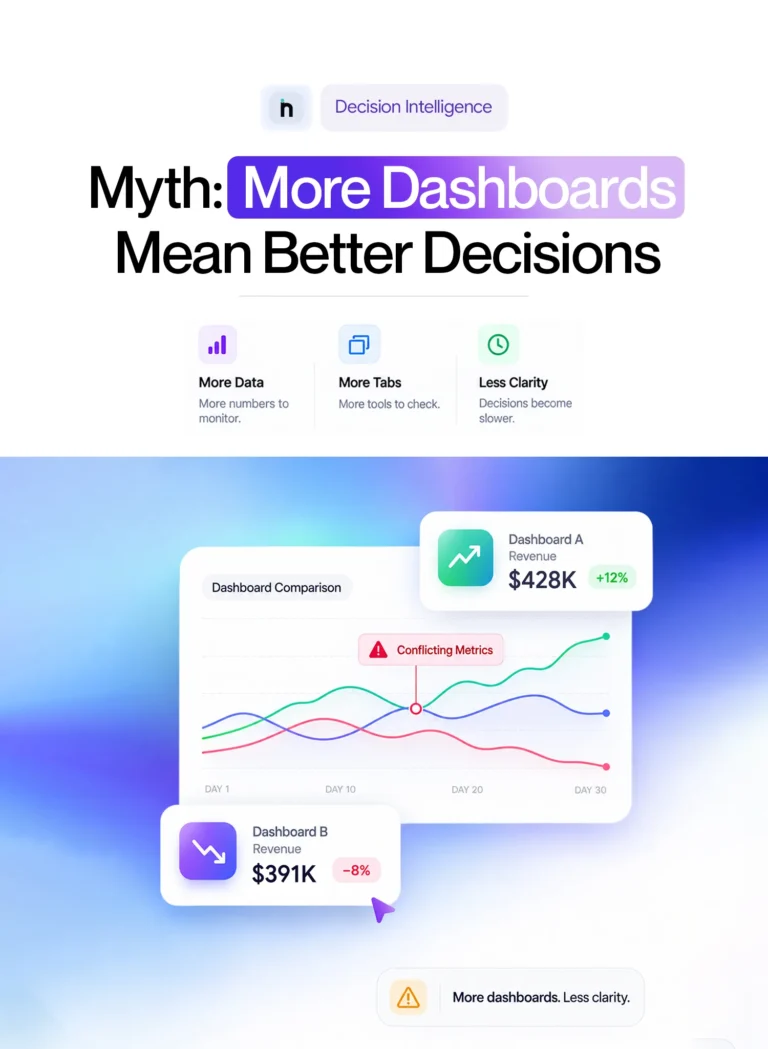
Your ecommerce store already contains the answers. Learn how AI ecommerce analytics helps founders ask business questions, understand what changed and why, and move from scattered data to clearer decisions.