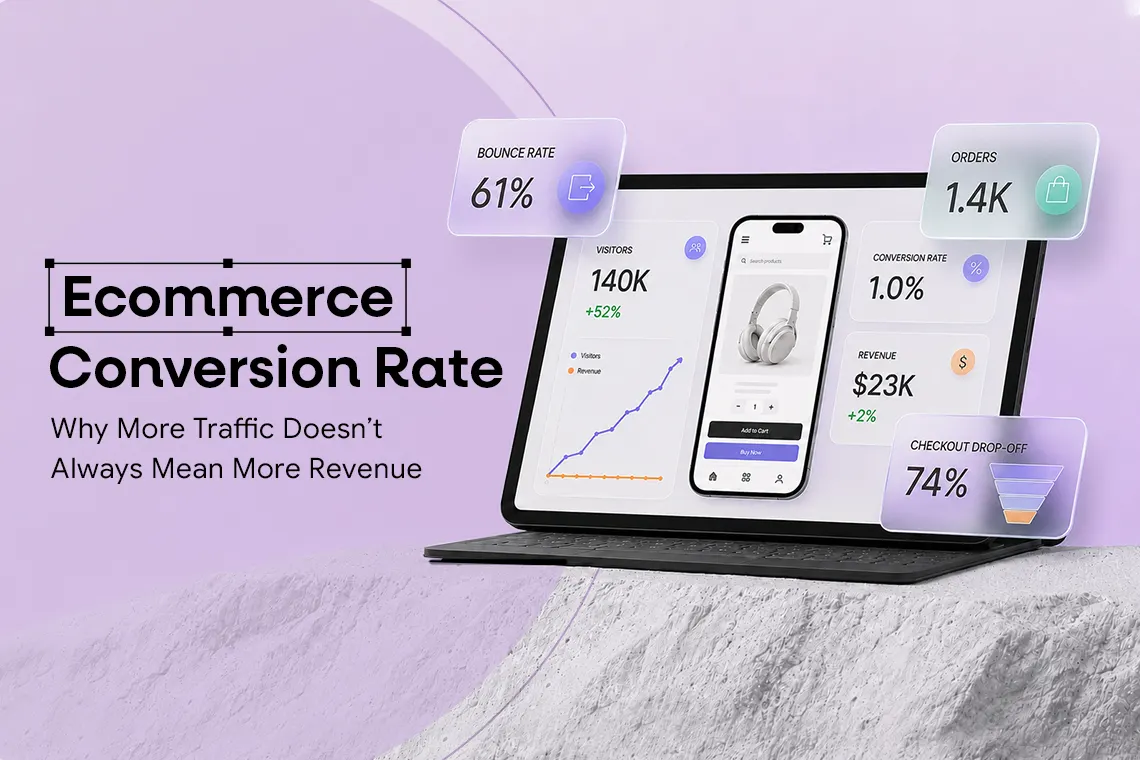
More traffic feels like progress.
Organic sessions are rising. Paid campaigns are bringing in more visitors. Email campaigns are generating clicks.
Yet revenue is barely moving.
That is because traffic alone does not create sales. It only creates an opportunity to sell.
What happens after a visitor arrives determines whether that opportunity becomes revenue.
That is why ecommerce conversion rate matters.
A growing D2C brand should not only ask:
“How can we drive more traffic?”
A growing D2C brand should also ask:
“Are we converting the traffic we already have into enough revenue?”
Traffic creates potential. Conversion determines how much of that potential becomes revenue.
What Is Ecommerce Conversion Rate?
Ecommerce conversion rate measures how effectively an online store turns website visits into purchases.
A simplified formula is:
Ecommerce Conversion Rate = Purchases ÷ Website Visits × 100
If a store receives 100,000 visits and generates 2,000 purchases, its conversion rate is 2%.
There is no universal “good” ecommerce conversion rate. Performance varies by industry, product price, device, audience and traffic source.
Shopify’s ecommerce conversion guidance highlights this variation, which is why brands should compare their performance against relevant benchmarks as well as their own historical data.
For founders, the better question is not:
“Are we above the industry average?”
It is:
“Why did our conversion rate change?”
Does More Website Traffic Increase Sales?
More website traffic can increase sales, but only when those visitors have enough purchase intent and the ecommerce funnel converts them effectively.
Consider this example:
|
Metric
|
Month A
|
Month B
|
|
Website visits
|
100,000
|
150,000
|
|
Conversion rate
|
2.0%
|
1.2%
|
|
Orders
|
2,000
|
1,800
|
|
Average Order Value
|
$60
|
$60
|
|
Revenue
|
$120,000
|
$108,000
|
Traffic increased by 50%, but revenue fell.
Why?
The additional visitors did not convert well enough.
This is why website traffic vs conversions should never be analysed separately.
A useful revenue model is:
Traffic × Conversion Rate × Average Order Value = Revenue
More traffic creates more opportunities.
A stronger conversion rate turns more visitors into customers.
Higher AOV increases the value of each purchase.
If one part weakens, growth in another may not be enough.
That is why a data-driven ecommerce growth strategy should connect acquisition, conversion and customer value.
Why Does More Traffic Sometimes Produce Fewer Sales?
When a brand has more traffic but no sales growth, the problem usually appears somewhere between acquisition and checkout.
Traffic Quality Has Declined
Not every visitor has the same likelihood of buying.
Someone searching for a specific product may have much stronger intent than someone arriving through broad social content.
A campaign can generate cheap clicks and large traffic volumes while contributing little revenue.
This makes traffic quality vs traffic quantity an important distinction.
Founders should review traffic alongside conversion, CAC, AOV and customer value rather than treating sessions as a success metric on their own.
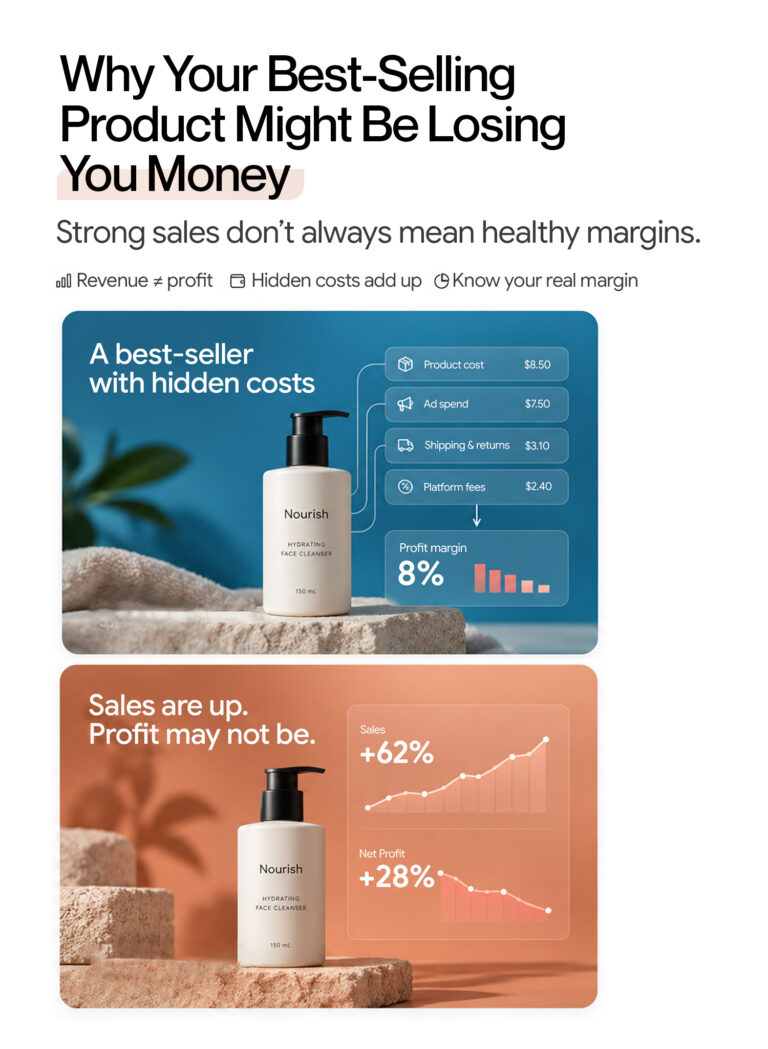
The same principle applies when evaluating CAC versus LTV for D2C profitability.
The Landing Page Does Not Match Intent
Even qualified traffic may not convert if the post-click experience does not match what the visitor expected.
An ad promising:
“20% Off Lightweight Summer Dresses”
should not send visitors to a generic homepage.
A stronger journey is:
Ad or Search → Relevant Landing Page → Product → Cart → Checkout
The same applies to CRM and retention campaigns.
A strong email open rate or click-through rate does not guarantee revenue if the landing experience is weak.
Where Is Your Ecommerce Conversion Funnel Leaking?
The ecommerce conversion funnel shows how visitors move from arriving on the website to completing a purchase.
A simplified funnel is:
Website Visit → Product View → Add to Cart → Checkout → Purchase
Google Analytics 4 Funnel Exploration can help teams understand where users progress or leave the journey.
Funnel Stage | Metric to Watch | Main Question |
Traffic | Qualified sessions | Are the right visitors arriving? |
Product page | Add-to-cart rate | Is the product creating buying intent? |
Cart | Cart progression | Is friction appearing before checkout? |
Checkout | Checkout completion | Are customers completing payment? |
Purchase | Conversion rate | How effectively does traffic become revenue? |
The final conversion rate tells you what happened.
The individual funnel stages help explain where the problem started.
That distinction matters because every leak requires a different solution.
Product Pages and Checkout Can Matter More Than More Traffic
If qualified visitors are reaching product pages but few add anything to cart, more traffic may simply increase the number of people encountering the same problem.
A strong product page should quickly answer:
- What am I buying?
- Why should I choose it?
- What does it look like?
- Which option is right for me?
- When will it arrive?
- Can I return it?
Product-page improvements can therefore create more revenue from existing acquisition spend.
Checkout is equally important.
Baymard Institute consistently finds that a large share of shopping carts are abandoned before purchase. While some abandonment is natural, unexpected costs, delivery concerns, account requirements and payment friction can stop high-intent shoppers.
That creates a useful diagnostic pattern:
Traffic healthy → Product interest healthy → Cart activity healthy → Purchases weak
In that case, acquiring more traffic is unlikely to solve the real problem.
Why Mobile Performance Can Reduce Ecommerce Conversion Rate
A traffic increase may also change the type of visitor reaching the store.
For eg: paid social campaigns can bring a large number of mobile users.
If the mobile experience is slow or difficult to use, traffic may rise while conversion falls.
Common friction includes:
- Slow page loads
- Difficult navigation
- Poor filtering
- Unstable layouts
- Complicated mobile checkout
Website performance should therefore be treated as a commercial issue, not only a technical SEO issue.
Before paying for more mobile traffic, make sure the store can convert the traffic it already receives.
Why a Blended Conversion Rate Can Be Misleading
Suppose your ecommerce conversion rate falls from 2.5% to 2%.
The blended number looks negative, but it does not explain what changed.
Perhaps branded search still converts strongly.
Maybe returning customers are stable.
Perhaps desktop conversion improved while a new paid-social campaign dramatically increased low-intent mobile traffic.
That is why conversion should also be segmented by:
- Traffic Source
- Campaign
- Device
- Landing Page
- Product Category
- Geography
- New vs Returning Customers
The objective is not simply to discover that conversion declined.
It is to identify where the decline came from.
How Can You Increase Ecommerce Revenue Without More Traffic?
The biggest growth opportunity may already exist inside your current traffic.
Imagine a store receives:
100,000 monthly visits
with a:
2% conversion rate
and:
$60 AOV
Revenue is:
100,000 × 2% × $60 = $120,000
If traffic stays unchanged but conversion improves to 2.3%:
100,000 × 2.3% × $60 = $138,000
That is $18,000 more revenue without acquiring another visitor.
If AOV also rises to $65:
100,000 × 2.3% × $65 = $149,500
This is why ecommerce growth should not always start with “spend more.”
A better sequence can be:
Improve traffic quality → Fix funnel leaks → Increase AOV → Improve retention → Scale acquisition
That creates a stronger foundation for profitable ecommerce growth.
What Should Founders Track Alongside Ecommerce Conversion Rate?
Conversion rate becomes much more useful when connected with other metrics.
|
Metric
|
What It Explains
|
|
Website traffic
|
Number of opportunities
|
|
Add-to-cart rate
|
Product buying intent
|
|
Cart abandonment
|
Where intent is lost
|
|
Checkout completion
|
Ability to close the sale
|
|
Conversion rate
|
How effectively visits become orders
|
|
Average Order Value
|
Revenue generated per order
|
|
Revenue per visitor
|
Commercial value of traffic
|
|
CAC
|
Cost of acquiring customers
|
|
Repeat purchase rate
|
Value created after first purchase
|
These metrics should be treated as a connected system.
That is why the weekly ecommerce metrics founders should track are more useful when the relationships between them are visible.
A Simple Framework for High Traffic and Low Conversion
When traffic increases but revenue does not, follow the signal instead of changing everything at once.
|
What You See
|
Investigate First
|
|
Traffic ↑, product views ↓
|
Traffic relevance, landing page
|
|
Traffic ↑, add-to-cart ↓
|
Product page, pricing
|
|
Add-to-cart ↑, checkout ↓
|
Cart experience, shipping
|
|
Checkout ↑, purchases ↓
|
Payment and checkout friction
|
|
Conversion stable, revenue ↓
|
AOV, discounts, product mix
|
|
Mobile traffic ↑, conversion ↓
|
Mobile UX and speed
|
|
Email clicks ↑, revenue flat
|
Post-click customer journey
|
The important question is not:
“Which metric is red?”
It is:
“Which relationship changed, and what should we investigate next?”
How Netsights Connects Traffic, Conversion and Revenue
Most ecommerce businesses do not have a shortage of data. The real challenge is understanding how different signals relate to one another.
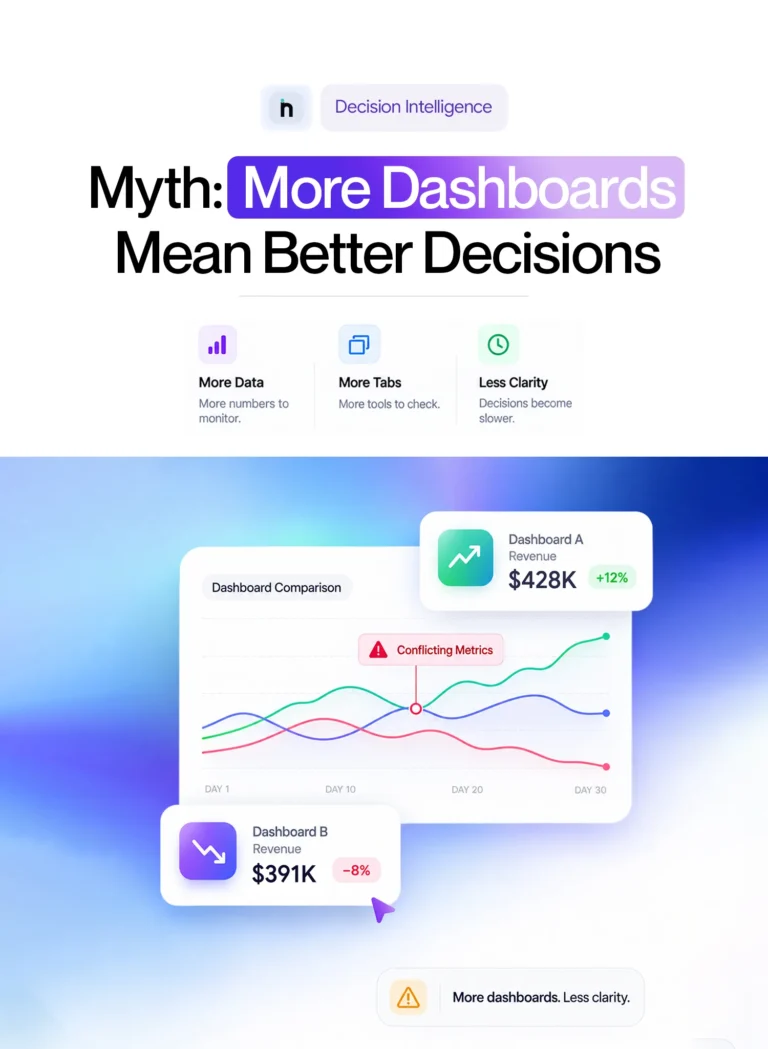
Traffic may increase in GA4. Ad spend may rise across Meta and Google. Shopify may show more sessions, while conversion rate declines and revenue stays flat. Looking at each platform separately tells the team what happened inside that channel, but it does not always explain why overall business performance changed.
Netsights helps ecommerce teams connect these signals so traffic, conversion, customer behaviour, product performance and revenue can be analysed as parts of the same growth system.
Instead of asking only:
“Did traffic increase?”
teams can investigate:
“Where did the additional traffic come from, how well did it convert, what happened to AOV, and did the increase actually create profitable revenue?”
Scaleboard Brings the Performance Story Together
The Scaleboard provides a connected view across marketing, products, customers and store performance.
This matters because an ecommerce conversion problem rarely exists in isolation.
For example, a drop in revenue could be caused by lower traffic, weaker conversion, a decline in Average Order Value or a change in product mix. Similarly, an increase in traffic may look positive until the team discovers that the new visitors are converting poorly and increasing Customer Acquisition Cost.
By bringing related metrics into one operating view, Scaleboard helps founders move beyond isolated platform reporting and see how changes in one area affect another.
iSight Helps Identify What Changed and Where to Investigate
iSight adds an AI-powered intelligence layer to ecommerce performance monitoring.
It can help monitor metrics such as revenue, ROAS, conversion rate, advertising spend and AOV, while surfacing unusual changes that may require attention.
Suppose website traffic rises by 30%, but conversion rate falls sharply.
Seeing only the traffic increase could make acquisition look successful. Seeing only the conversion decline does not explain what caused it.
The more useful investigation is:
Did the new traffic come from a particular campaign?
Was the decline concentrated on mobile?
Did one landing page or product category perform differently?
Did AOV or revenue per visitor change at the same time?
That context helps teams move from simply spotting a weak KPI towards understanding where the problem may be coming from.
Netification Helps Important Changes Reach the Team Earlier
Netification adds automated reporting and KPI alerts to the workflow.
Instead of waiting until the next weekly review to discover that conversion has weakened or ad spend has moved outside an expected range, teams can receive relevant performance updates through channels such as WhatsApp, Slack or email.
For a growing ecommerce business, earlier visibility matters.
A conversion problem discovered after several days of paid traffic may have already affected a significant amount of revenue. Surfacing meaningful changes sooner gives the team more time to investigate and respond.
Netty Makes Follow-Up Analysis More Conversational
Netty gives ecommerce teams a conversational way to explore their performance data.
Rather than moving between dashboards and manually comparing reports, a founder or manager can begin with the business question.
For example:
“Why did conversion fall yesterday?”
“Which traffic source had the biggest decline?”
“Did the increase in traffic generate more revenue?”
“Which products contributed most to the change?”
This helps shorten the journey from identifying a performance signal to understanding what deserves further investigation.
Together, these capabilities change the analytics workflow from:
Traffic changed → Conversion changed → Revenue changed
to:
What changed → What else changed with it → Why does it matter → Where should we investigate next?
That is the idea behind ecommerce decision intelligence: connecting data to business context so teams can spend less time finding numbers and more time deciding what to do with them.
More visitors are not the goal. More profitable value from every visit is.
Conclusion: Traffic Is an Opportunity, Not a Revenue Guarantee
Traffic matters, but more visitors do not automatically mean more revenue.
A store can increase sessions while conversion falls. It can grow orders while CAC worsens. It can improve conversion while AOV declines.
That is why ecommerce conversion rate should be analysed alongside traffic quality, product engagement, checkout behaviour, AOV, CAC and revenue per visitor.
Before asking how to bring another 50,000 visitors to the store, ask:
How much more value could we generate from the visitors already arriving?
Netsights helps ecommerce teams connect these signals, identify performance changes and focus attention on the areas that can influence profitable growth.
More traffic creates opportunity. Better conversion turns it into revenue.
FAQs