Show the numbers that explain growth, efficiency and what happens next.
A board deck can look polished, be packed with charts and still leave investors asking the same question:
So, is the business actually getting stronger?
Revenue may be up. ROAS may look healthy. Traffic may be growing. But investors usually want to understand what sits underneath those numbers.
Are you acquiring customers efficiently? Are those customers coming back? Are margins improving? How quickly are you recovering acquisition costs? And can the business keep growing without creating a cash problem?
That is why the ecommerce metrics investors care about go well beyond topline sales. The best board decks connect growth with profitability, customer quality, marketing efficiency and cash.
For D2C founders, the goal is not to squeeze every available KPI into the deck. It is to show what changed, why it changed and what management plans to do next.
Why investors want more than revenue growth from an ecommerce board deck
Revenue matters, but revenue alone rarely tells the whole story.
Imagine two D2C brands both growing at 25%.
The first is improving repeat purchases, controlling CAC and increasing contribution margin. The second is spending aggressively on paid media, offering deeper discounts and generating lower-margin orders.
On paper, both are growing.
Economically, they are very different businesses.
A useful board deck should help investors answer four basic questions:
How fast are we growing? Is that growth profitable? Are our customers becoming more valuable? Can we sustain it?
This is where ecommerce decision intelligence becomes useful. A metric only becomes valuable when it helps explain a business condition and supports a decision.
Turn board metrics into clearer business decisions.
The ecommerce metrics investors care about most
There is no universal board-deck template.
A subscription brand, fashion retailer and high-ticket furniture business will naturally emphasise different numbers. But most investor conversations come back to the same themes: growth, margin, acquisition efficiency, customer value, retention and cash.
Those are the metrics that reveal whether scale is strengthening the business or simply making it bigger.
1. Revenue growth should explain where growth is coming from
Showing that revenue increased 18% is useful.
Explaining why it increased is much more useful.
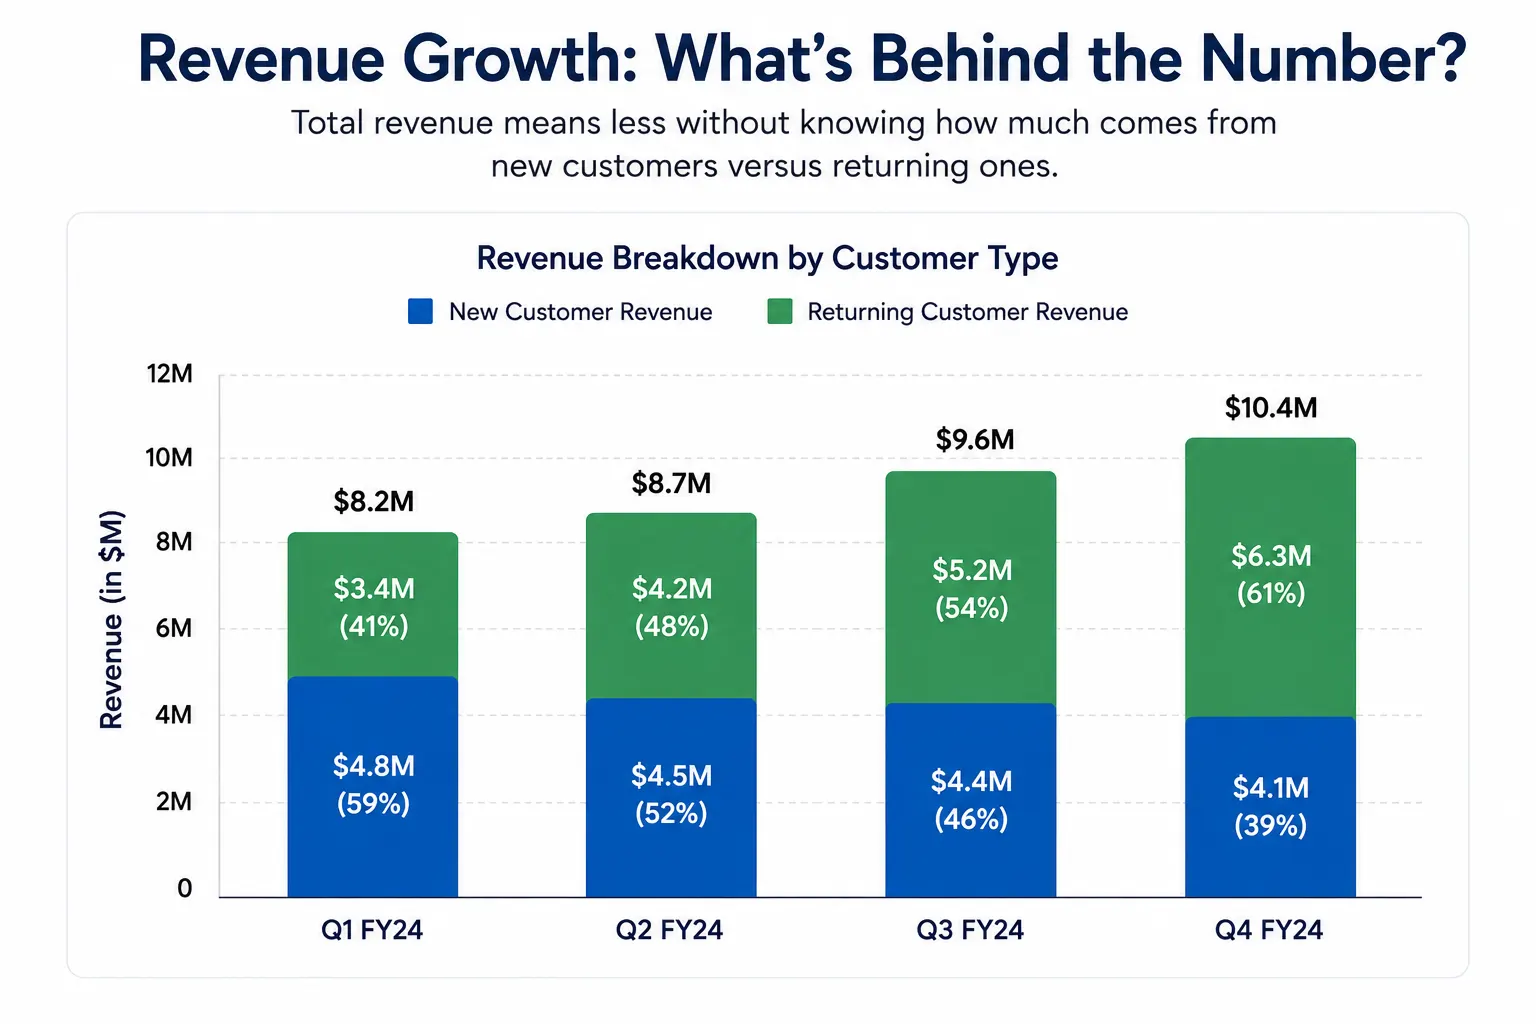
Break revenue down by the drivers that matter to your business. That could mean new versus returning customers, geography, product category, acquisition channel or subscription versus one-time purchases.
Suppose quarterly revenue rises 18%, but returning-customer revenue grows 30% while new-customer revenue grows only 4%.
That tells the board something important: retention is doing more of the heavy lifting.
The revenue slide should therefore answer two questions:
What changed? What drove the change?
Avoid turning it into a monthly sales report. Investors need the pattern, not every transaction.
2. Gross margin and contribution margin show whether growth is worth having
A business can sell more and still become less profitable.
That is why investors look beyond revenue to gross margin and contribution margin.
Gross margin typically shows what remains after the cost of goods sold. Contribution margin goes further by accounting for other variable costs such as fulfilment, payment processing, discounts and returns.
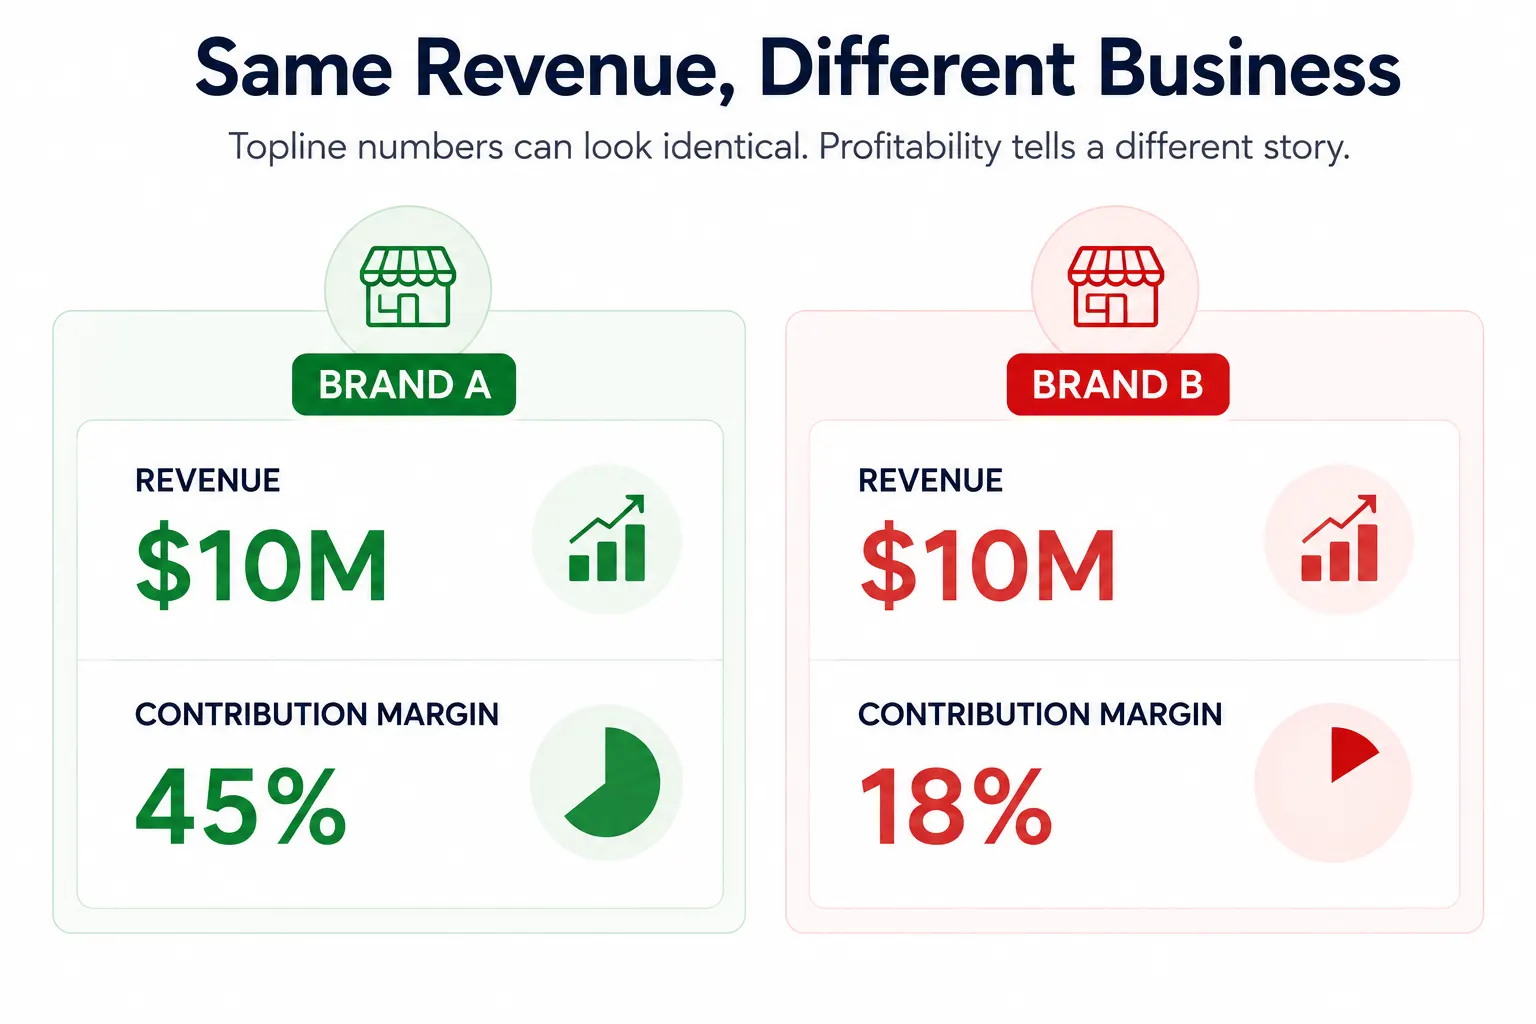
Consider two brands generating $10 million in revenue.
One has a 45% contribution margin. The other has 18%.
Their revenue is identical, but their ability to fund marketing, people and expansion is completely different.
This is why DTC unit economics deserves board-level attention.
3. Customer acquisition cost shows whether growth is getting more expensive
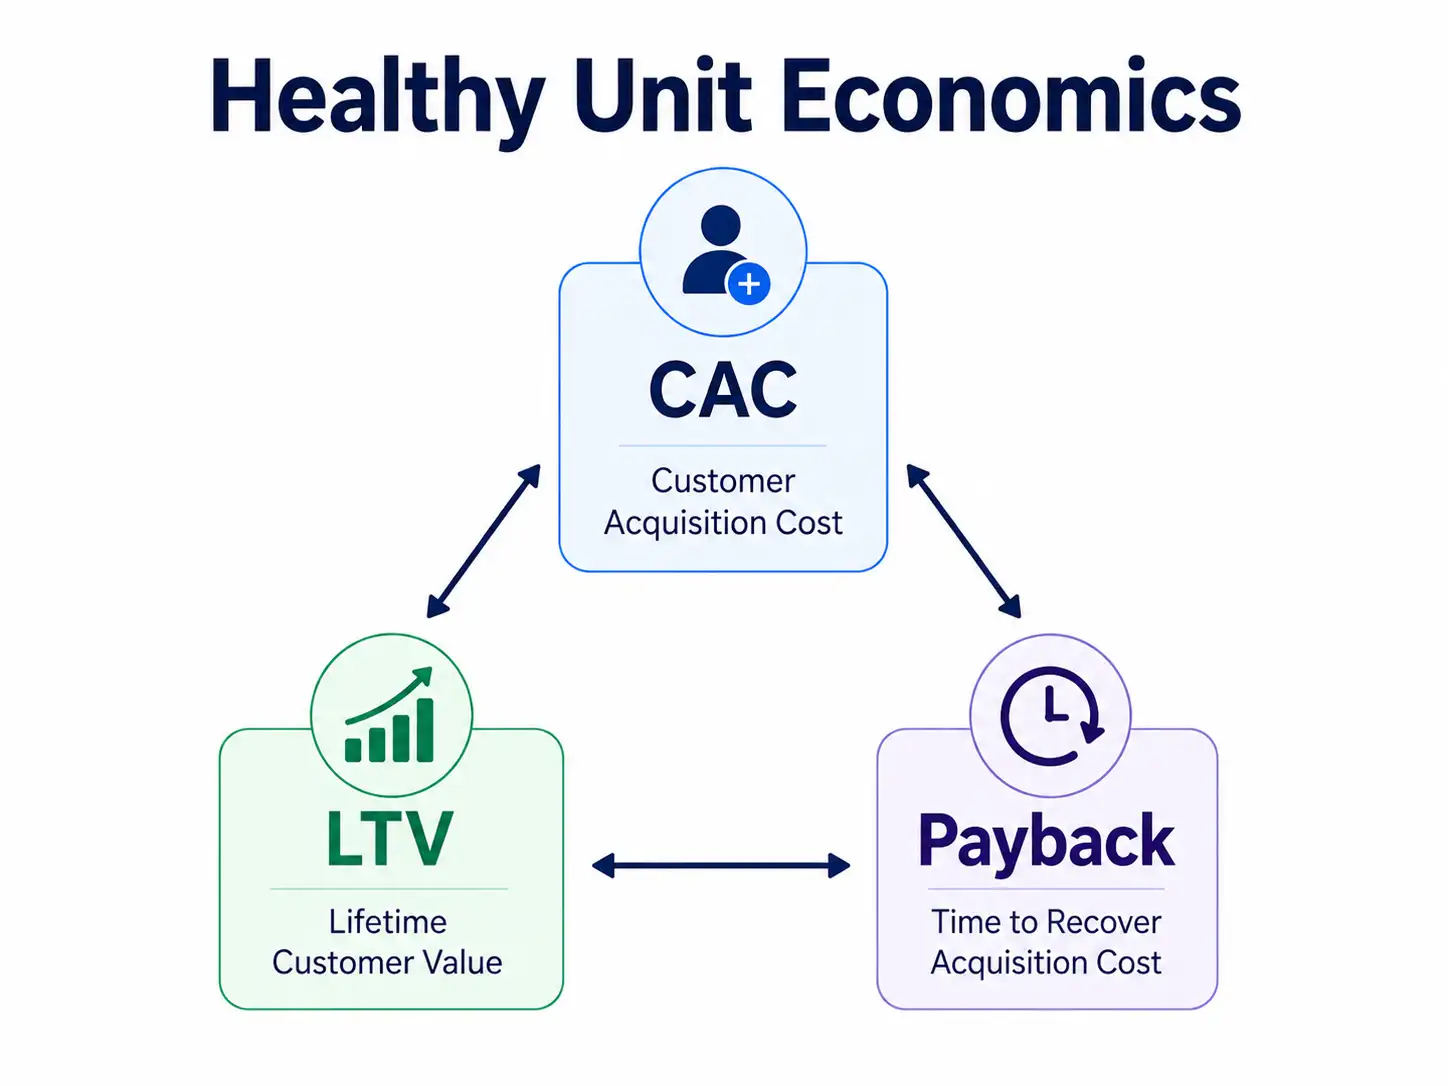
Customer acquisition cost, or CAC, tells investors how much it costs to acquire a new customer.
CAC = Total sales and marketing cost ÷ New customers acquired
The important point is that CAC should reflect more than ad spend.
Depending on the business, agency fees, creative production, affiliate commissions, influencer costs and relevant software expenses may all contribute to acquisition cost.
A $70 CAC might be perfectly healthy if the customer ultimately contributes $500 in value.
The same CAC becomes a problem if the customer contributes only $90.
That is why CAC should always be viewed alongside LTV, payback and retention.
For more context, read about CAC vs LTV for D2C profitability.
4. LTV:CAC shows whether customer economics support scaling
Customer lifetime value estimates how much economic value a customer generates over their relationship with the brand.
The LTV:CAC ratio compares that value with the cost of acquiring them.
LTV:CAC = Customer lifetime value ÷ Customer acquisition cost
But the ratio is only useful when the assumptions are clear.
If LTV:CAC improves from 2.2x to 3.1x, explain what changed.
Did CAC decline? Did purchase frequency improve? Did margins rise? Did customers stay active for longer?
The story behind the ratio is what investors really need.
See whether acquisition is creating long-term value, not just short-term growth.
5. CAC payback period shows how quickly growth returns cash
LTV tells you what a customer may be worth over time.
CAC payback asks a different question:
How long until we recover what we spent acquiring that customer?
Imagine two brands with similar LTV:CAC ratios.
Brand A recovers its CAC in three months. Brand B takes twelve.
Brand B needs far more working capital to grow at the same pace.
That makes the payback period especially important for fast-growing ecommerce businesses.
Your board deck should show the current payback period, how it is trending and whether certain channels or customer groups recover CAC faster than others.
You can go deeper with this guide to customer acquisition cost payback period.
6. Retention and repeat purchase rate show customer quality
Acquisition creates the first order.
Retention determines whether that customer becomes valuable.
A brand can grow rapidly by acquiring more customers every month, but investors may question the quality of that growth if most people never buy again.
Instead of showing only one blended retention number, consider 30-, 60-, 90- and 180-day repeat purchase behaviour.
That gives the board a much better sense of customer quality.
It also helps explain whether customer retention or acquisition is driving growth.
7. Cohort analysis shows whether new customers are getting better or worse
Blended averages can hide a lot.
Suppose your overall repeat purchase rate is 28%.
That sounds fine, but what if customers acquired six months ago repurchase at 35% while recent customers are only reaching 18%?
The blended number hides deterioration.
Cohort analysis lets you group customers by acquisition month, channel, product or first-order discount and compare how they behave over time.
A practical board slide might show first-order AOV, 90-day repeat rate, six-month customer revenue and contribution margin by cohort.
This turns historic customer data into a forward-looking signal.
Track the customer trends that can shape your next board decision.
8. Conversion rate shows how efficiently existing demand turns into revenue
Conversion rate is often treated as a CRO metric.
For investors, it is also an efficiency metric.
If traffic remains stable but conversion improves, the business can generate more revenue without increasing acquisition spend at the same rate.
That creates operating leverage.
The board does not need every checkout statistic. It needs to understand whether conversion is improving, whether the change is material and what caused it.
For more context, see ecommerce conversion rate.
9. Marketing efficiency should go beyond ROAS
A strong Meta ROAS does not automatically mean the overall business is acquiring customers efficiently.
Different platforms can claim credit for the same customer journey, and reported ROAS may not account for contribution margin or repeat behaviour.
That is why the board should look beyond platform-level numbers.
Connect ROAS with blended CAC, new-customer revenue, contribution margin and overall marketing efficiency.
The question investors care about is not:
“Did Meta report a 4.2x ROAS?”
It is:
“Did our marketing spend create profitable incremental demand?”
That is where marketing attribution becomes essential.
Connect ROAS, CAC, revenue and customer value in one clearer view.
10. Cash burn, runway and working capital show whether growth can be funded
Fast-growing ecommerce businesses can still run into cash problems.
Inventory is purchased before it is sold. Marketing spend happens before CAC is recovered. Returns may reverse revenue after cash has already been committed elsewhere.
That is why board reporting should connect growth with cash.
Depending on the business stage, investors may want to see operating cash flow, burn rate, runway, inventory commitments and working capital requirements.
The purpose is not to turn the board deck into a finance pack.
It is to show whether the growth plan can actually be funded.
How to turn ecommerce investor metrics into a clear board story
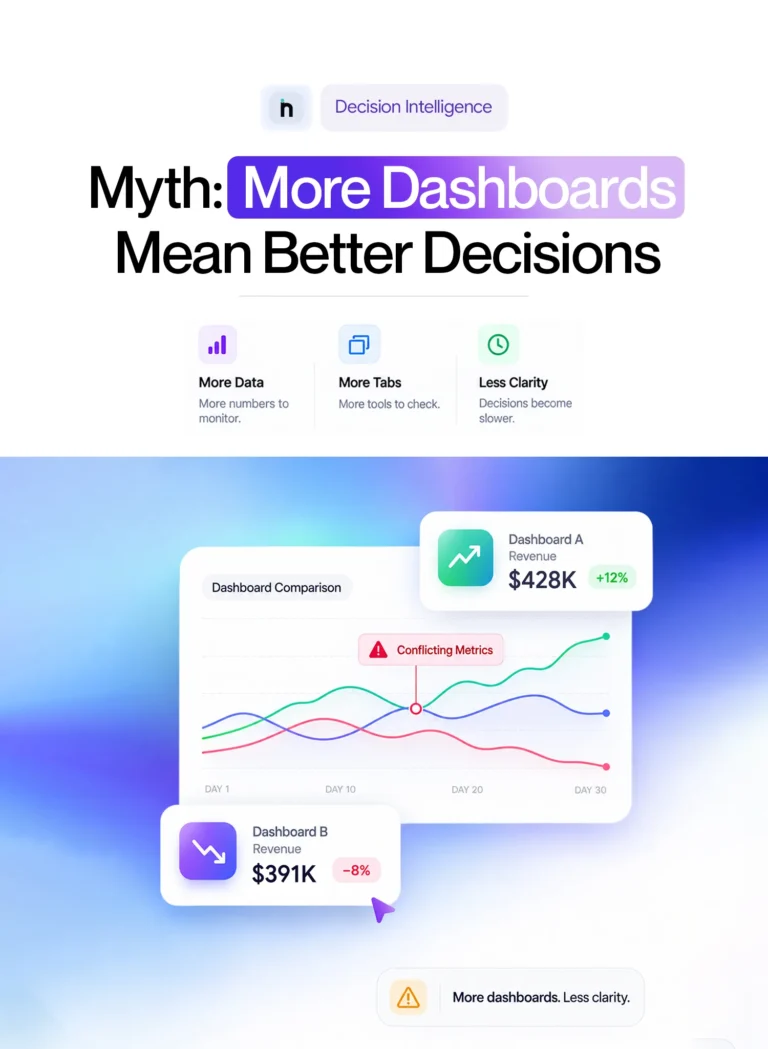
A board deck should not feel like a dashboard export.
Each important slide should answer three questions:
What happened? Why did it happen? What are we doing next?
Suppose CAC rises from $42 to $51.
Do not show the chart and move on.
Explain that paid-social costs increased, prospecting conversion weakened and creative performance declined. Then show what management is changing.
That turns reporting into decision-making.
It also helps reduce the decision fatigue caused by bad analytics.
Spend less time reporting what happened and more time deciding what happens next.
What should not dominate an ecommerce board deck?
Not every metric deserves equal space.
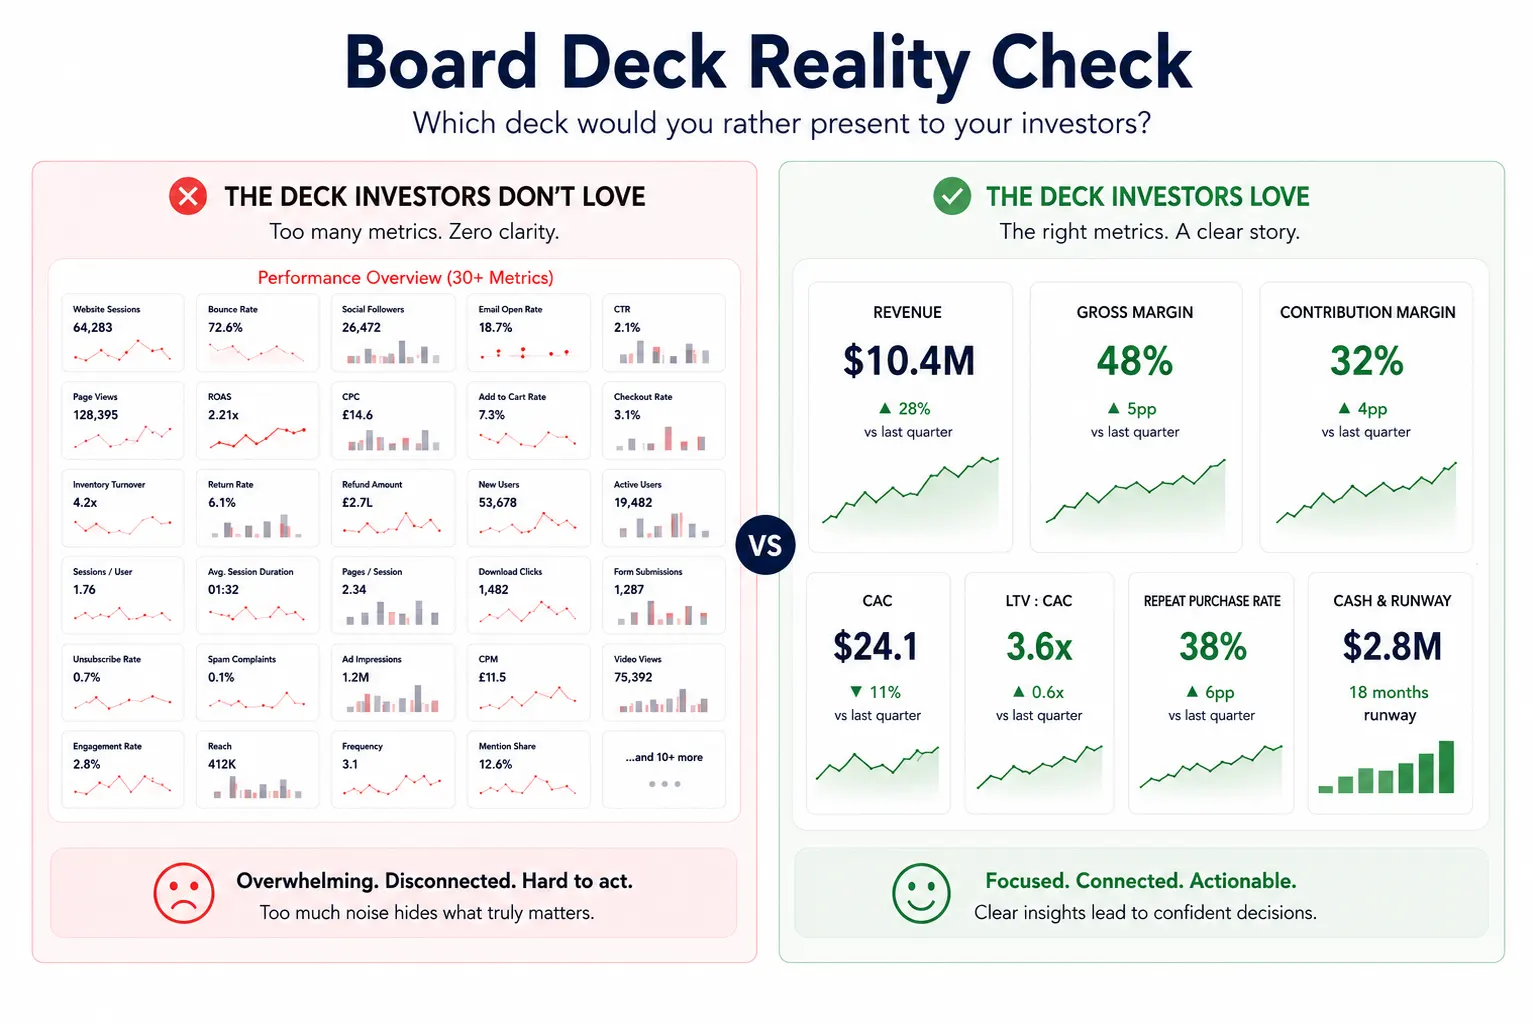
Page views, impressions, social followers, email open rates and individual ad CTRs can all help teams diagnose performance.
But they do not automatically show whether the business is creating sustainable value.
For example, an email campaign might have an excellent open rate while revenue from email falls.
In that case, the board should care more about conversion, retention and contribution than the open rate itself.
The same principle is discussed in the NetSights guide to D2C email open rates.
A useful rule is:
If a metric cannot help explain growth, customer quality, efficiency, profitability or risk, ask whether it belongs in the main deck.
A simple ecommerce board deck KPI structure investors can follow
A board deck does not need 50 KPI slides.
A cleaner narrative is:
Growth → Economics → Customer Quality → Efficiency → Cash → Outlook
Supporting operational detail can sit in the appendix.
This is much easier to follow than presenting separate screenshots from Shopify, GA4, Klaviyo, Meta Ads and finance systems.
The same principle applies to weekly reporting. Founders often get more value from a smaller set of weekly ecommerce metrics than from constantly expanding their dashboards.
How NetSights helps turn board reporting into decision-ready insight
Board reporting gets complicated because the data investors want rarely lives in one place. Revenue may sit in Shopify, acquisition data in Meta Ads and Google Ads, customer behaviour in GA4, retention data in Klaviyo, and margin or cash figures in finance systems.
NetSights helps bring these signals into a more connected view, so teams can spend less time reconciling reports and more time understanding what changed and why.
For example, rising revenue may look positive until it is viewed alongside CAC, repeat purchase rate and contribution margin. Growth could be coming from more expensive acquisition or heavier discounting, or it could be supported by stronger retention and healthier customer economics.
iSight helps teams investigate important performance changes, while Netification can surface meaningful KPI movements without constant dashboard checking.
The value for board reporting is stronger context. Instead of simply saying:
“CAC increased by 17%.”
the team can explain:
“CAC increased by 17% because prospecting costs rose and conversion weakened. We are reallocating spend and improving landing-page performance to reduce payback time.”
That creates a clearer board story around revenue, acquisition, retention and profitability, not just a collection of metrics.
Bring revenue, acquisition, retention and profitability into one decision-ready view.
What ecommerce metrics investors care about should shape the story you tell
The ecommerce metrics investors care about are not necessarily the first numbers shown in Shopify or your ad dashboards.
Revenue matters, but investors want to know whether that revenue is valuable.
CAC matters, but only when viewed alongside LTV, margin and payback.
Retention matters because it shows whether customers continue creating value after the first purchase.
Cash matters because even attractive growth has to be funded.
The strongest board decks connect these metrics:
Revenue → Margin → CAC → Customer Value → Retention → Cash
Your board does not need more metrics. It needs a clearer growth story.
NetSights helps ecommerce teams connect marketing, customer, revenue and operational signals so board conversations can focus on decisions rather than data collection.
Know what changed. Understand why. Show investors what happens next.
Start your Free Trial or contact the NetSights team to build a clearer view of the metrics behind your ecommerce growth.
One order can have many marketing touchpoints. Your business still needs one reconciled view.
FAQs