
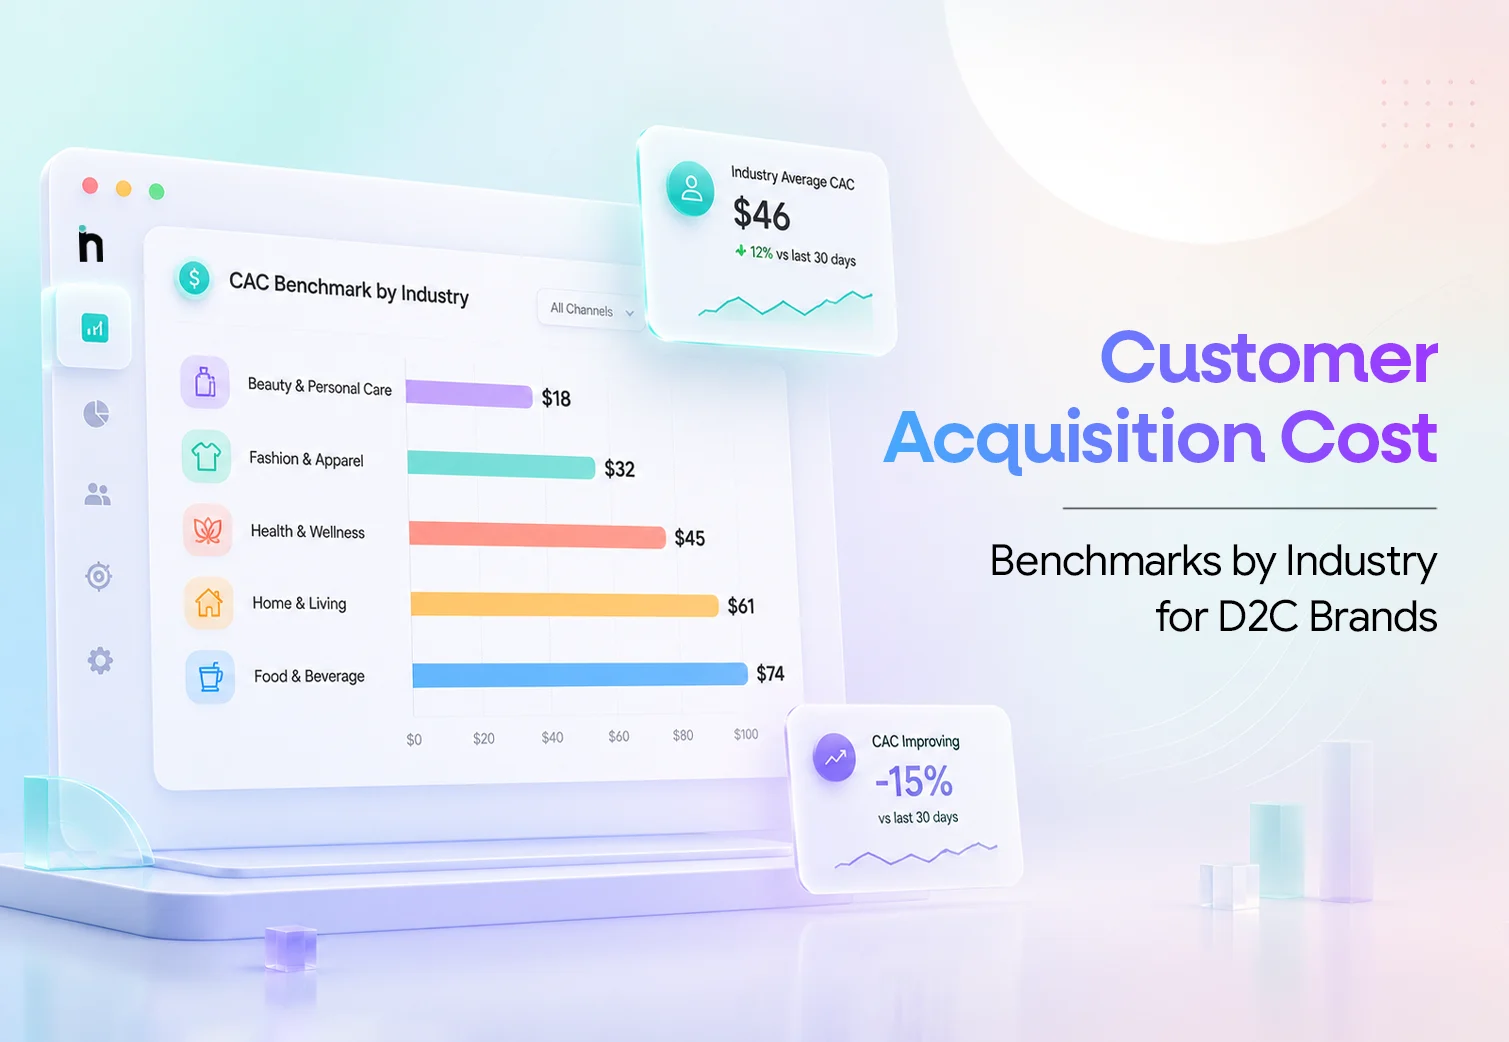
Your D2C brand spent $55 to acquire a new customer last month.
Is that expensive?
It depends.
For a brand with low margins and weak repeat purchase behaviour, a $55 Customer Acquisition Cost (CAC) may be difficult to sustain. But for another business with a higher Average Order Value (AOV), stronger margins and customers who return regularly, the same CAC could be perfectly healthy.
This is why customer acquisition cost benchmarks by industry are useful, but they should not be treated as fixed targets.
A benchmark can help you understand whether your CAC is high or low compared with similar businesses. What it cannot tell you is whether that cost works for your own business model.
Current ecommerce acquisition data puts average CAC at approximately $41.83 as of April 2026.
But that does not mean every D2C brand should aim for the same number.
Fashion, beauty, food, pet care, home and luxury brands all have different conversion rates, margins, purchase cycles and Customer Lifetime Value (LTV).
So the more useful question is:
Can we keep acquiring customers at this cost while maintaining healthy unit economics?
That is what this guide will help you understand.
See how your CAC connects with conversion, customer value and profitability.
Customer Acquisition Cost measures how much your business spends, on average, to acquire one new customer.
The basic calculation is:
CAC = Total Customer Acquisition Costs ÷ New Customers Acquired
If your business spends $50,000 on acquisition and gains 1,000 new customers, CAC is $50.
The calculation is simple. What matters more is what you include.
A broader CAC calculation may consider:
A media buyer may focus mainly on advertising efficiency. A founder usually needs a wider view of what the business is spending to grow its customer base.
This distinction becomes more important as brands scale across several acquisition channels.
For more context, read our guide to CAC vs LTV for D2C profitability.
One reason CAC benchmarks become confusing is that Customer Acquisition Cost and Cost Per Acquisition (CPA) are often treated as the same metric.
Google Ads defines average CPA as conversion cost divided by the number of conversions generated.
But a conversion does not always mean a genuinely new customer.
A D2C brand may therefore have:
All four can be different.
Before comparing your CAC with an industry benchmark, ask:
Those questions are often more useful than the benchmark itself.
Customer acquisition costs can vary considerably between D2C categories because every industry has a different mix of purchase intent, competition, Average Order Value, conversion rate and repeat-purchase behaviour.
Recent DTC paid-acquisition data provides a more useful 2026 reference point:
|
D2C Industry |
Average Paid CAC Reference |
|
Fashion & Apparel |
$32 |
|
Pet Products |
$37 |
|
Beauty & Skincare |
$39 |
|
Supplements & Wellness |
$43 |
|
Fitness & Activewear |
$44 |
|
Food & Beverage |
$48 |
|
Home Goods |
$55 |
These figures are based on recent paid-channel performance across DTC campaigns and should be treated as directional paid CAC benchmarks, not fully loaded business CAC. The dataset defines CAC as advertising spend divided by new customers acquired and combines performance across major paid channels.
That distinction is important.
Your true CAC may be higher once you include expenses such as creative production, agency support, affiliate commissions, marketing technology and relevant internal resources.
The table also shows why there is no single “good CAC” for ecommerce.
Fashion sits toward the lower end of this paid-acquisition dataset, while home goods run considerably higher. But that does not automatically make fashion more efficient. Home products typically have higher order values and longer buying cycles, while categories such as pet care and supplements can benefit from stronger repeat-purchase behaviour.
So instead of treating these numbers as targets, use them to ask:
“Are we acquiring customers efficiently for our category, and do our margins, repeat purchases and customer lifetime value support what we are paying?”
That is a much more useful way to interpret an industry CAC benchmark.
Fashion acquisition depends heavily on creative quality, paid social, merchandising and customer confidence.
Before purchasing, shoppers may think about:
That means rising CAC may not always be an advertising problem.
If traffic costs remain stable while fewer visitors buy, the issue could be slower pages, unavailable variants, unclear returns or weaker product-page conversion.
This is why fashion brands should analyse CAC alongside ecommerce conversion rate.
Sometimes improving acquisition efficiency does not require cheaper traffic. It requires getting more value from the traffic already being purchased.
Beauty has a different acquisition model.
Customers may need reviews, ingredient information, product education and several interactions before making their first purchase.
But once they find something they like, replenishment can significantly change customer economics.
A customer acquired for $55 who buys once is very different from a customer acquired for the same amount who places four orders over the year.
The important relationship becomes:
Acquisition → First Purchase → Repeat Purchase → Customer Lifetime Value
This is why beauty brands should not rank acquisition channels only by first-order CAC.
A slightly more expensive customer who repeatedly returns can ultimately be far more valuable.
That connects directly with the relationship between customer retention and acquisition.
Food and beverage brands can benefit from relatively high purchase frequency, but many operate with lower AOV and tighter margins.
Shipping, packaging and discounts can reduce how much of each first order remains after fulfilment.
So even a CAC that looks low compared with an ecommerce average can be difficult to support if customers rarely reorder.
For replenishment categories, the better sequence is:
CAC → First-Order Contribution → Repeat Purchase → Customer Value
A customer who appears unprofitable on order one can still become valuable through repeat purchases.
CAC therefore needs to be evaluated beyond the first transaction.
Pet care includes several products customers need repeatedly, including food, treats, supplements and grooming essentials.
That makes cohort analysis particularly useful.
Instead of looking only at January CAC, ask:
The cheapest acquisition source may not create the best customers.
A channel with slightly higher CAC but substantially better repeat behaviour can be the stronger growth investment.
A shopper buying a sofa, dining table or high-value jewellery item behaves differently from someone buying skincare.
High-consideration customers may:
These categories often experience lower conversion rates and longer attribution journeys.
That can lead to higher CAC.
But they may also benefit from significantly higher AOV and contribution per transaction.
The useful question is therefore not:
Why is our CAC higher than a beauty brand’s?
It is:
Does the value of the order justify what we spend to acquire the customer?
Several business characteristics explain most of the difference.
Higher AOV usually gives a brand more room to support acquisition.
But revenue alone can be misleading.
A high-value order with weak margins may still support less CAC than expected.
Contribution margin shows what remains after the variable costs required to generate and fulfil the sale.
Two brands can both generate a $100 order but have completely different amounts left after product costs, fulfilment, discounts and returns.
That is why CAC should be viewed alongside broader DTC unit economics.
If traffic costs remain stable but more visitors convert, acquisition efficiency improves.
Product pages, mobile UX, trust signals, delivery information and checkout can all influence CAC.
Customers who buy repeatedly can justify a higher acquisition investment than one-time customers.
This is why replenishment-based businesses often evaluate CAC differently from categories with long repurchase cycles.
Customer Lifetime Value (LTV) adds future customer value to the acquisition discussion.
A common rule of thumb is an LTV:CAC ratio around 3:1, although the appropriate level depends on margin, cash flow and business maturity.
The principle matters more than the exact ratio:
CAC tells you what you paid. LTV helps tell you what you received.
Returns can weaken customer economics after acquisition has already been paid for.
This is particularly important in fashion and other categories with higher return rates.
There is no universal “best CAC channel.”
The economics depend on the brand, product and audience.
Paid social can generate demand efficiently, especially for visual products.
Performance depends heavily on creative quality, audience saturation, CPM and website conversion.
Search can capture strong purchase intent, but branded and non-branded search should be reviewed separately.
A customer searching your brand may have first discovered you somewhere else.
Organic traffic does not carry a media CPA, but SEO is not free.
Content, technical work, tools and internal resources all contribute to acquisition costs.
Creator and affiliate performance can be harder to attribute accurately because customers may see content, search the brand and purchase later through another route.
This is why CAC should be interpreted within a broader marketing attribution framework.
A common assumption is:
“If we acquire customers for $35 today, increasing spend should simply bring us more customers at $35.”
That rarely continues indefinitely.
Early advertising spend often reaches the easiest customers first.
As budgets grow, brands may need to reach:
Creative can also fatigue and competition can rise.
So the question eventually shifts from:
What is our average CAC?
to:
What is happening to acquisition efficiency as we spend more?
Our guide to scaling an ecommerce business from $1M to $10M explores this in more detail.
Existing efficiency does not guarantee the same efficiency at higher spend.
A useful CAC benchmark starts with your own economics.
Ask five questions.
Revenue is not the same as profitability. Look at what remains after product and fulfilment costs.
Repeat purchases can significantly change acquisition economics.
A higher CAC may be reasonable if it consistently produces customers with stronger LTV.
A customer can eventually be profitable but still create cash-flow pressure if acquisition takes too long to repay.
Our guide to CAC payback period explains why this matters.
Your own historical CAC trend can often be more useful than an external benchmark.
A steady rise over several months deserves attention even if the number still looks acceptable against an industry average.
Imagine two acquisition channels.
Channel A acquires customers cheaply, but most purchase only once.
Channel B costs more, but its customers return more often and generate higher lifetime value.
A dashboard sorted only by CAC will favour Channel A.
A founder looking at customer economics may choose Channel B.
This is the key shift:
CAC → Customer Quality → Retention → LTV → Profitability
rather than:
CAC → Lower Is Always Better
Cheap acquisition is only valuable when the customers acquired are worth having.
Modern customer journeys rarely belong neatly to one channel.
A customer may:
See a social ad → Search the brand → Visit the website → Join an email list → Return directly → Purchase
Which channel acquired them?
Google Analytics defines attribution as assigning conversion credit across the touchpoints involved in a user’s journey.
This is why platform-reported CPA, channel CAC and blended business CAC may not match.
Platform data is useful for campaign optimisation.
Founder-level decisions need broader business context.
A rising CAC should trigger an investigation, not an immediate budget cut.
What You See | What to Check | Possible Reason |
CAC rising, CPM rising | Media costs | Competition or saturation |
CAC rising, CTR falling | Creative | Fatigue or weak messaging |
CAC rising, CVR falling | Website | UX or traffic-quality issue |
CAC rising, AOV rising | Unit economics | Increase may still be sustainable |
CAC rising, LTV rising faster | Customer quality | Higher CAC may be acceptable |
CAC stable, margin falling | Product economics | Profitability is weakening |
Seeing CAC rise tells you what happened.
Looking at connected metrics helps explain why.
That is also the principle behind a stronger data-driven growth strategy.
CAC went up. Understand what changed before you change the budget.
Consider a hypothetical skincare brand.
CAC has increased steadily over several months.
The first assumption is that paid advertising has become too expensive.
But deeper analysis shows:
The business was still paying roughly the same amount to attract visitors.
It was simply converting fewer of them.
Reducing advertising would have lowered customer volume without fixing the underlying problem.
The more useful path was:
CAC increased → Media stable → Conversion declined → Mobile journey weakened → Fix conversion
That is the difference between tracking a metric and understanding it.
Customer acquisition does not end when someone clicks an ad.
If a brand pays for qualified traffic but loses shoppers at checkout, that acquisition investment has already been made.
Baymard Institute’s research puts average documented cart abandonment at around 70%. Not every abandoned cart can be recovered.
But avoidable issues such as unexpected costs, unclear delivery, poor mobile usability and complicated forms can make CAC more expensive than necessary.
The media creates the opportunity. The rest of the customer journey determines how much of that opportunity turns into revenue.
Improving CAC is not always about reducing marketing spend. In many cases, the bigger opportunity is to make the entire acquisition journey more efficient.
That can mean improving conversion rates, strengthening creative performance, increasing Average Order Value, reducing checkout friction, improving retention or shifting budget towards channels that bring higher-quality customers.
The goal is not simply to spend less.
It is to get more value from every dollar spent on acquiring a new customer.
Review product pages, mobile UX, delivery information, reviews and checkout before chasing cheaper traffic.
Creative fatigue can raise acquisition costs. Test different hooks, benefits, use cases, formats and customer problems rather than making superficial design changes.
Bundles, cross-sells and sensible order thresholds can improve the economics around the CAC you already have.
Retention does not change the original acquisition cost. It changes what that acquisition produces over time.
Ask which channels produce the most valuable customers, not only which ones acquire them most cheaply.
ROAS can remain strong while new-customer acquisition weakens, particularly when returning customers generate campaign revenue.
Use the ROAS optimisation checklist alongside CAC.
Founders do not need dozens of CAC reports.
They need enough context to answer four questions:
Review new customers, paid CAC and blended CAC.
Review CPM, CPC and CTR.
Review conversion rate and checkout performance.
Review AOV, contribution margin, repeat behaviour, LTV and payback.
Instead of reporting:
CAC increased this week.
the useful insight is:
CAC increased because conversion weakened while traffic costs remained stable.
Those statements lead to very different decisions.
For a broader framework, see the weekly ecommerce metrics founders should review.
Bring acquisition, conversion and customer performance into one connected view.
As D2C brands grow, acquisition data becomes fragmented.
Ecommerce platforms contain orders and customer data. Advertising platforms show campaign performance. Analytics tools capture traffic and conversion. CRM platforms hold engagement and retention signals.
The challenge is connecting those signals quickly enough to make a useful decision.
NetSights helps D2C teams bring business performance signals together so CAC can be interpreted alongside the metrics that influence it.
With iSight, teams can identify meaningful performance movements and investigate related changes.
Netty enables business users to start with questions such as:
Netification helps automate recurring reporting so teams spend less time assembling numbers and more time interpreting them.
The broader workflow becomes:
Connected Data → Performance Change → Diagnosis → Decision → Action
That is more useful than tracking CAC as another isolated dashboard number.
Move from tracking CAC to understanding what is driving it.
Industry CAC benchmarks are useful for understanding where your acquisition costs stand, but they should never be treated as the final measure of performance.
A benchmark cannot account for your margins, Average Order Value, repeat purchase behaviour, return rates, product mix, cash flow or how quickly you recover acquisition spend.
Your own business data can.
Instead of asking:
“Is our CAC lower than the industry average?”
ask:
“Can we keep acquiring customers at this cost and still grow profitably?”
That requires looking beyond CAC and understanding how it connects with:
Conversion → AOV → Contribution Margin → Retention → LTV → Payback
When these metrics are viewed together, CAC becomes much more than a marketing KPI. It helps you understand whether your acquisition strategy is creating sustainable growth or simply increasing customer volume at a higher cost.
The goal is not always to achieve the lowest CAC.
It is to acquire the right customers at a cost your business can sustainably support.
Don’t just track CAC. Understand what is driving it and what it means for growth.
A: One current ecommerce reference puts average CAC at approximately $41.83 as of April 2026. It should be treated as a broad reference because acquisition costs vary significantly by industry, margins, geography and customer value.
A: A good CAC is one that your contribution margin, customer lifetime value and cash flow can sustainably support.
A: CAC varies because product prices, conversion rates, competition, margins, purchase frequency and customer lifetime value differ across categories.
A: CPA generally measures the advertising cost needed to generate a defined conversion. CAC focuses specifically on the broader cost of acquiring a new customer.
A: No. A cheap customer who never purchases again may be less valuable than a higher-CAC customer who repeatedly returns.
A: Both. Paid CAC helps assess advertising efficiency, while blended CAC gives founders a broader view of business-level customer acquisition.
We write about growth, retention, and the numbers that actually predict what happens next for D2C brands. Have a topic you'd like us to cover? Get in touch .
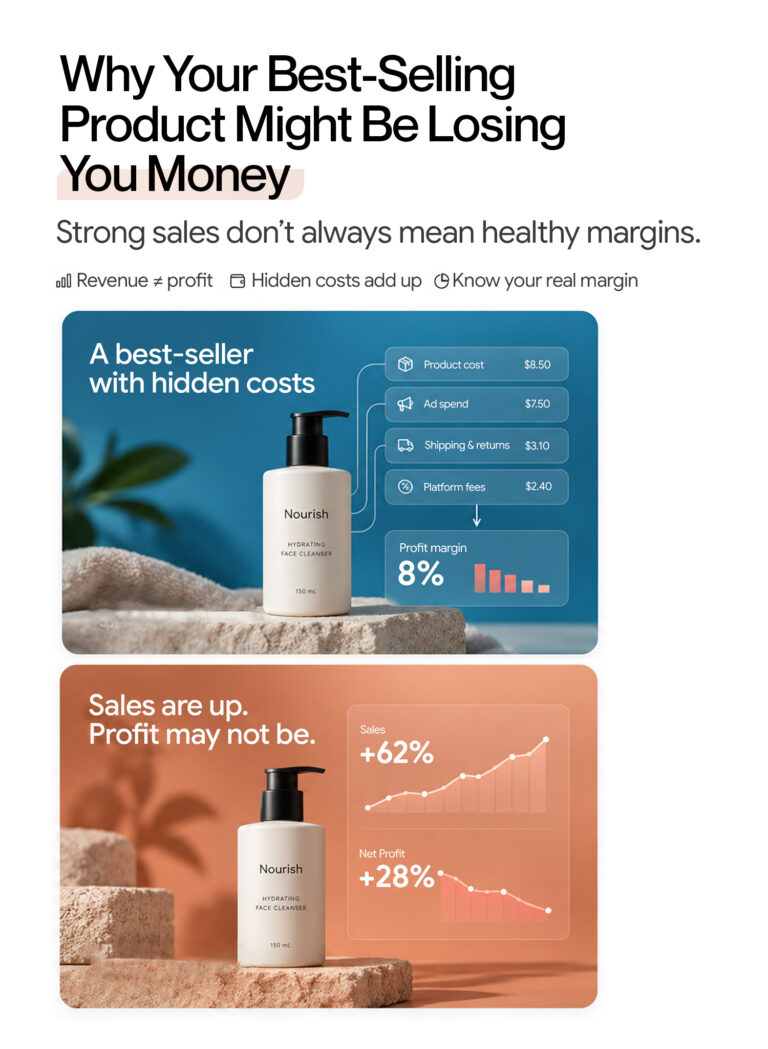
A product can be a best performer in your sales charts and still money is lost on each order. Product profitability shows what is left after deducting product costs, discounts, shipping, ads, and returns. Here’s how to analyze the gap between strong sales and healthy profit, and what to do about it. Every Monday, Alisha […]
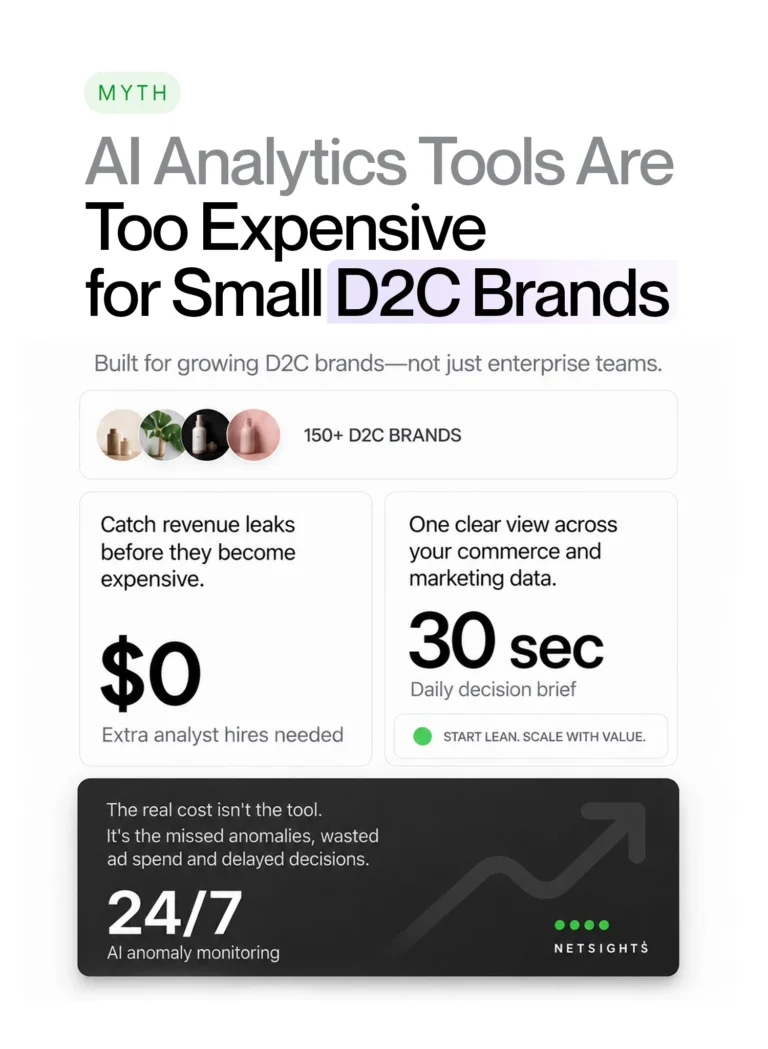
Your ecommerce store already contains the answers. Learn how AI ecommerce analytics helps founders ask business questions, understand what changed and why, and move from scattered data to clearer decisions.
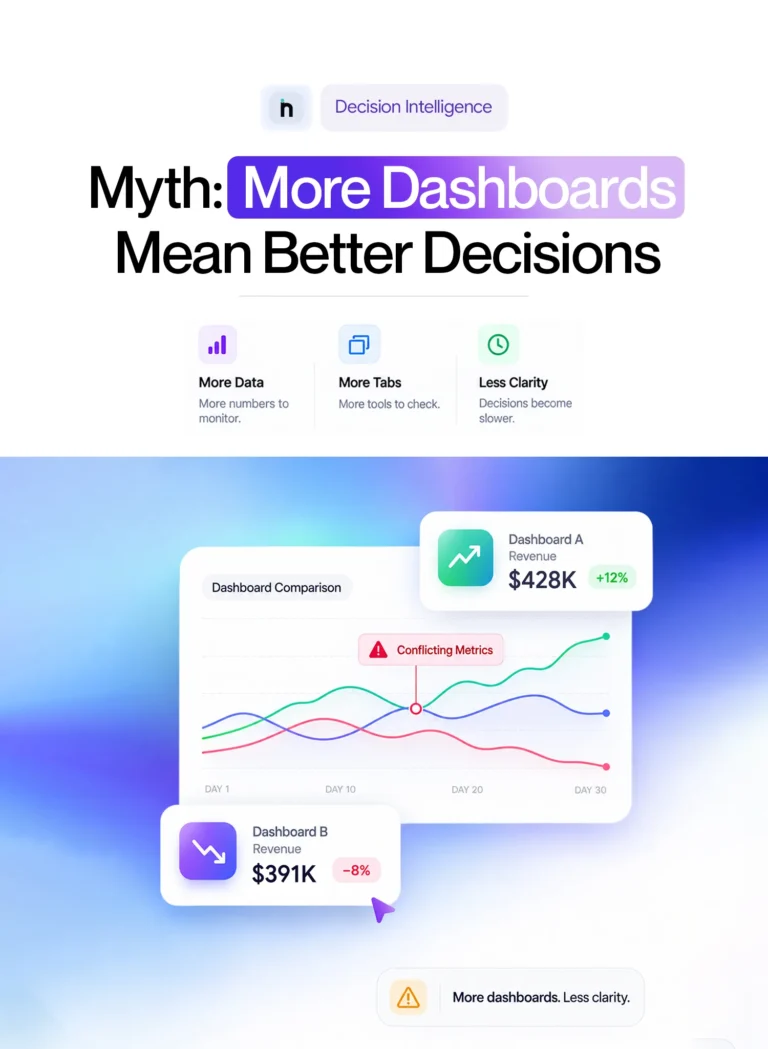
Your ecommerce store already contains the answers. Learn how AI ecommerce analytics helps founders ask business questions, understand what changed and why, and move from scattered data to clearer decisions.