
Most ecommerce brands spend a lot of time thinking about how to generate more demand.
More traffic. Better ROAS. Higher conversion rates. More customers.
But there is another question that can quietly determine whether that demand turns into revenue:
Do you actually have the inventory to fulfill it?
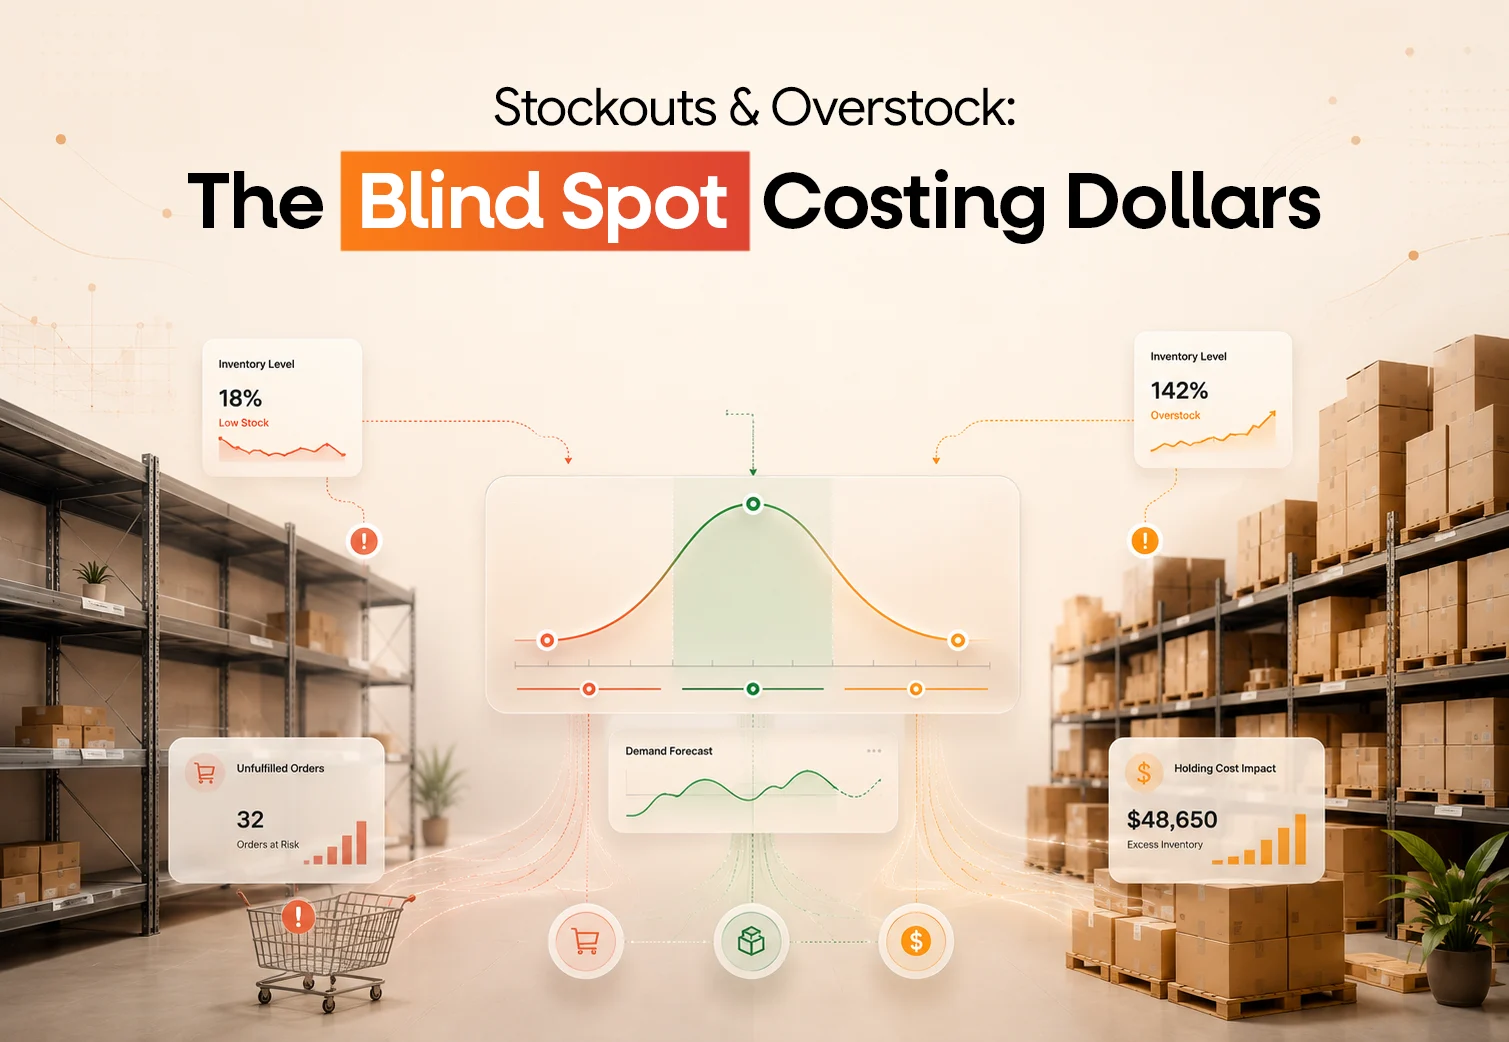
A product going out of stock can stop sales at the exact moment demand is highest. On the other hand, buying too much inventory can leave thousands of dollars sitting in a warehouse, tying up cash and eventually forcing discounts.
These are not separate problems.
They are two sides of the same inventory management challenge.
IHL Group’s 2026 Inventory Distortion Study estimates that out-of-stocks and overstocks cost retailers around $1.7 trillion globally each year, equivalent to 6.2% of global retail sales. Out-of-stocks alone account for 65.6% of that distortion.
For ecommerce brands, the goal is not to hold as much inventory as possible or as little as possible.
It is to have the right products, in the right quantities, at the right time.
Inventory management is the process of tracking, forecasting, ordering, storing and replenishing products so an ecommerce business can meet customer demand without holding unnecessary inventory.
For a small store with a handful of products, this may be relatively straightforward.
As the business grows, it becomes much harder.
A Shopify store might have hundreds of SKUs, multiple variants, different locations, incoming purchase orders and products that sell at completely different speeds.
Then marketing enters the picture.
A successful Meta campaign can increase demand quickly. An influencer mention can create an unexpected sales spike. A seasonal promotion can change product velocity within days.
That means inventory cannot be managed by looking only at how many units are physically sitting in a warehouse.
Shopify categorises inventory into different states, including on hand, available, committed, unavailable, and incoming. Understanding these categories gives businesses a clearer view of what stock they actually have available to sell, rather than simply relying on the total units physically in inventory.
The larger the ecommerce operation becomes, the more important this distinction is.
A stockout happens when a customer wants to purchase a product but there is not enough available inventory to fulfil the order.
The immediate cost is obvious.
You lose the sale.
But the real cost can be larger.
Imagine you sell a product for $40 and normally sell 40 units a day.
If the product is unavailable for five days:
40 × $40 × 5 = $8,000
You have potentially missed $8,000 in revenue.
Now consider how those customers arrived.
Some may have come through paid advertising. Others may have discovered the product through organic search, email, social media or an influencer campaign.
You may have already paid to generate that demand.
If the product cannot be purchased, that demand cannot convert.
There is also the possibility that the customer buys from a competitor instead.
For products with repeat-purchase potential, that can mean losing more than the first transaction.
This is why stockout costs should not be measured only as lost sales.
They can also affect acquisition efficiency, customer retention, brand perception and future revenue.
Running out of a product that sells five units a month is very different from running out of a bestseller responsible for 25% of your revenue.
This is where SKU-level analysis becomes important.
A store may report 95% overall product availability while its highest-revenue product has only three days of stock remaining.
The average looks healthy.
The business has a problem.
If stockouts cost you revenue, overstock costs you cash.
Overstock inventory is stock held in quantities greater than what the business is likely to sell within a reasonable period.
Consider a brand that invests $20,000 in a new product line.
Demand is weaker than expected.
Six months later, $8,000 worth of products are still sitting in inventory.
That money is now tied up.
It cannot easily be used for the next product launch, marketing campaign, hiring or other business priorities.
The longer inventory remains unsold, the greater the risk.
Seasonal products can lose relevance. Fashion products can go out of season. Consumer preferences can change. New product launches can reduce demand for older SKUs.
Eventually, the business may need to discount the products to move them.
That can turn an inventory problem into a margin problem.
If products become extremely difficult to sell, they may become dead stock, leaving the business with limited options beyond clearance, bundling or writing down the inventory.
There is no universal answer.
A stockout creates lost demand.
Overstock creates trapped capital.
|
Stockout |
Overstock |
|
|
Core problem |
Not enough inventory |
Too much inventory |
|
Immediate impact |
Lost sales |
Cash tied up |
|
Customer impact |
Cannot purchase |
Usually limited |
|
Long-term risk |
Lost customers |
Discounts and dead stock |
|
Main challenge |
Replenishment |
Demand planning |
The interesting part is that both can come from the same underlying issue:
An inaccurate demand forecast.
Suppose you expect to sell 1,000 units next month.
If you sell only 500, you have excess inventory.
If you sell 1,500, you risk a stockout.
The purchasing decision was based on the same forecast.
That is why better inventory management starts with better demand planning.
One of the easiest ways to forecast inventory is to look at what sold last month.
If you sold 1,000 units last month, you plan for roughly 1,000 next month.
It is simple.
It is also easy to get wrong.
Ecommerce demand can change because of promotions, seasonality, pricing, advertising, influencer activity, product launches and competitor behaviour.
Imagine a product normally sells 20 units a day.
A creator posts about it and demand jumps to 50 units a day.
Your previous sales history still says 20.
Your inventory does not care about the historical average.
It needs to fulfil the demand that is happening now.
This is why ecommerce demand forecasting should combine historical performance with future demand signals.
The question is not simply:
“What did we sell?”
It is:
“What is likely to change what we sell next?”
You don’t need to track dozens of metrics in order to know your inventory status.
Several metrics will allow you to see whether inventory moves, sits, or runs out.
Inventory turnover shows how fast you move your inventory through sales.
High turnover may indicate efficiency of selling products, low turnover – that you have extra stock.
However, turnover should always be analyzed in the right context. High inventory turnover also means that there is too little inventory and that risk of stockout increases.
Sell-through rate shows what percentage of your inventory was sold over a certain period of time.
This metric can be useful when you want to find out products that sell less than expected.
This metric shows how many days you would spend to finish your current inventory, taking into account your current sales rate.
This way, it can help you determine products that approach possible stockout.
Forecast accuracy compares planned demand to actual demand.
In case your forecasts are off by miles, it would affect your orders.
This metric allows to answer a simple yet very relevant question:
Are the customers able to purchase your promoted products?
That question connects inventory directly to marketing performance.
Consider two products.
|
Product A |
Product B |
|
|
ROAS |
5.0x |
2.5x |
|
Inventory remaining |
4 days |
90 days |
|
Primary risk |
Stockout |
Overstock |
If you only look at ROAS, Product A wins.
You might increase its budget.
But if that additional demand pushes the product out of stock, you have created a new problem.
Product B has the opposite issue.
It has plenty of inventory, but capital is sitting in a product that is not moving quickly.
So the better question is not:
“Which product has the best ROAS?”
It is:
“Which product can generate profitable demand while we have enough inventory to fulfill it?”
This is where inventory data and marketing data need to work together.
It is also why understanding ecommerce decision intelligence matters as brands scale.
Safety stock is extra inventory kept as a buffer against unexpected demand or supply delays.
IBM describes safety stock as inventory held to reduce the risk of stockouts and account for demand and supply variability.
You can read IBM’s guide to safety stock for a deeper explanation.
A reorder point tells you when replenishment should begin.
A simplified formula is:
Reorder Point = Demand During Lead Time + Safety Stock
Suppose you sell 20 units per day and your supplier takes 10 days to deliver.
Demand during lead time:
20 × 10 = 200 units
If you maintain 50 units as safety stock:
200 + 50 = 250 units
Your reorder point would be 250 units.
The important part is that the calculation depends on your assumptions.
If demand suddenly doubles, the old reorder point may no longer be enough.
That is why inventory planning should be reviewed as demand changes rather than treated as a set-and-forget calculation.
The goal is not to wait until inventory reaches zero.
You want to identify the risk early enough to act.
A practical process is:
Forecast → Monitor → Alert → Act
Start by forecasting demand using historical sales and upcoming demand signals.
Then monitor sales velocity and days of inventory at the SKU level.
Set alerts for products approaching critical thresholds.
Finally, act.
Depending on the situation, that might mean placing a replenishment order, expediting incoming stock, reducing advertising or redirecting customers toward another product.
Automated alerts can make this process easier.
Netification helps businesses create alerts around important performance thresholds, reducing the need to constantly monitor reports manually.
The goal is simple:
See the stockout coming before the customer does.
Overstock becomes easier to manage when you identify it early.
Suppose a product has 120 days of inventory while comparable products sell through in 30 days.
That is a signal worth investigating.
The answer is not always a discount.
Ask what changed.
Was demand lower than expected?
Is the product page underperforming?
Has customer interest shifted?
Is pricing affecting conversion?
Is marketing sending the wrong audience?
The solution might be reducing future purchasing, improving merchandising, bundling the product with a bestseller or running a targeted promotion.
The earlier you identify slow-moving inventory, the more options you have.
Once inventory becomes dead stock, those options become much narrower.
There is a simple financial principle behind inventory management:
When you buy inventory, you convert cash into products.
You only turn that inventory back into cash when customers buy it.
If products move quickly, that cycle can work well.
If products sit for months, capital remains trapped.
That can limit how much you can spend on marketing, product development and growth.
This is why inventory should be considered alongside metrics such as CAC, contribution margin and customer lifetime value.
Our guide to DTC unit economics explores the metrics ecommerce brands need to understand whether growth is actually creating value.
A business can increase revenue while becoming more cash-constrained if too much capital is sitting in unsold inventory.
A useful inventory management framework comes down to four questions.
Know your actual available inventory by SKU and location.
Look at historical sales, current demand, promotions, marketing activity and seasonality.
Understand the financial impact of both a stockout and excess inventory.
Reorder, slow purchasing, change marketing spend, move inventory or adjust the offer.
This turns inventory management from a warehouse report into a business decision.
Most ecommerce brands do not have a data shortage.
They have a data connection problem.
Shopify knows what products are selling.
Advertising platforms know where demand is coming from.
Analytics platforms show customer behaviour.
Warehouse systems show what inventory is available.
The challenge is understanding what these signals mean together.
Imagine revenue drops 15%.
Is traffic down?
Did conversion fall?
Did paid advertising become less efficient?
Or did your best-selling product go out of stock?
If inventory data is separated from marketing and sales data, teams can spend hours investigating the wrong problem.
This is where NetSights fits into the workflow.
With iSight, ecommerce teams can bring performance signals together and identify changes that deserve attention.
The goal is not another dashboard filled with numbers.
It is a shorter path from:
Something changed → We understand why → We know what to do.
For businesses already spending hours pulling reports together, automated ecommerce reporting can also reduce the manual work required to understand performance.
Turn ecommerce data into action. Spot inventory risks early and make smarter decisions before they impact revenue.
Even brands with sophisticated ecommerce operations can make a few common mistakes.
A product selling 500 units a month should not have the same inventory strategy as one selling 20.
Inventory decisions should reflect sales velocity, margins and demand variability.
Past sales are useful, but they do not capture every future demand signal.
Marketing plans, seasonality and promotions can change what happens next.
Increasing ad spend on a product with limited inventory can accelerate a stockout.
Ignoring slow-moving products can leave capital trapped for months.
Revenue growth is not always healthy growth.
If revenue increases while inventory investment grows even faster, cash flow can deteriorate.
This is why inventory should be analysed as part of the broader ecommerce business, not as a separate operational metric.
Stockouts and overstock are not simply warehouse problems.
They are revenue, marketing and cash-flow problems.
A stockout can leave sales, acquisition spend and future customer value on the table.
Overstock can leave thousands of dollars tied up in products that are not moving.
Neither problem is solved by simply carrying more inventory.
The goal is to understand demand well enough to keep the right products available without tying up unnecessary capital.
That means looking at inventory alongside sales, marketing performance, customer behaviour and profitability.
For growing ecommerce brands, the competitive advantage is not knowing exactly what will happen.
It is knowing early enough when something is starting to change.
If your team is still combining Shopify reports, advertising dashboards and spreadsheets to understand what needs attention, explore NetSights and see how connected ecommerce intelligence can help your team make faster, data-backed decisions.
Because the most expensive inventory problem is often not the one you can see.
It is the one you discover too late.
Your Shopify, marketing and analytics data already contains the signals you need. NetSights helps bring those signals together so your team can spot important changes, understand what is happening, and act faster.
Stop waiting for inventory problems to show up in your revenue report.
A: Inventory management is the process of tracking, forecasting, ordering, storing and replenishing products so an ecommerce business can meet customer demand without holding unnecessary stock.
A: A stockout happens when a customer wants to purchase a product but there is not enough available inventory to fulfil the order.
A: Overstock inventory is stock held in quantities greater than expected demand. It can tie up working capital, increase carrying costs and eventually require discounts or clearance.
A: A stockout means there is not enough inventory to meet customer demand. Overstock means there is more inventory than the business is likely to sell efficiently. Both can result from inaccurate demand forecasting.
A: Brands can reduce stockouts through demand forecasting, inventory monitoring, safety stock, reorder points, supplier lead-time tracking and automated alerts.
A: Businesses can reduce overstock by improving demand forecasts, monitoring sell-through and inventory turnover, adjusting replenishment and identifying slow-moving products before they become dead stock.
We write about growth, retention, and the numbers that actually predict what happens next for D2C brands. Have a topic you'd like us to cover? Get in touch .
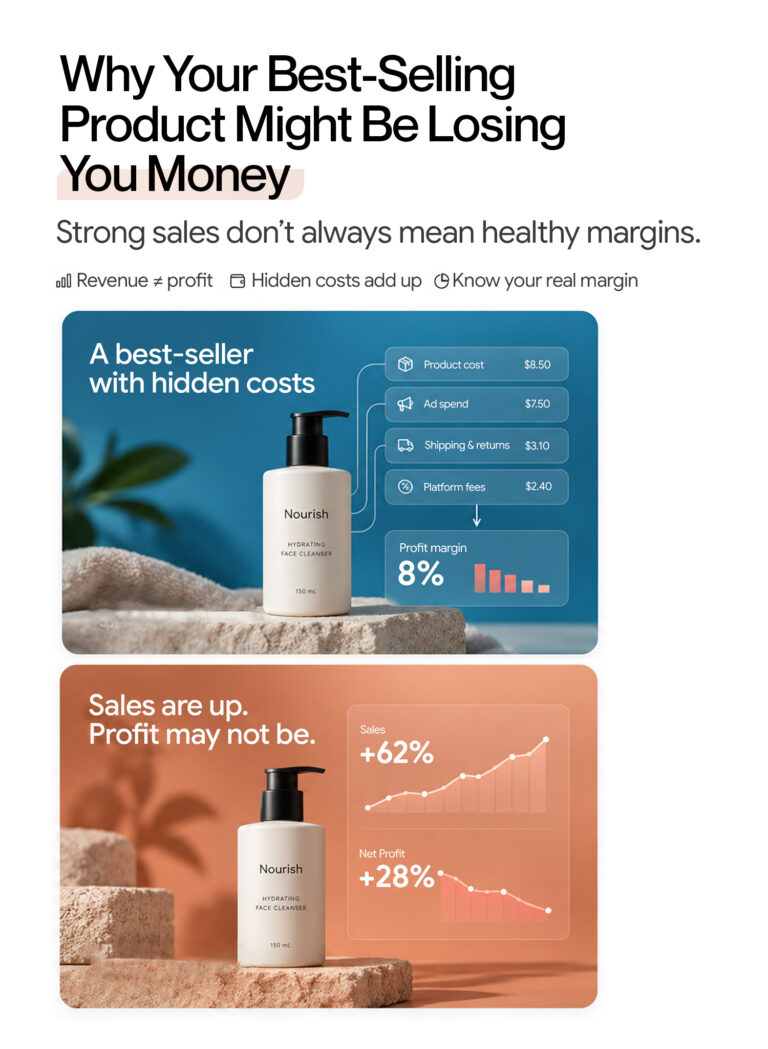
A product can be a best performer in your sales charts and still money is lost on each order. Product profitability shows what is left after deducting product costs, discounts, shipping, ads, and returns. Here’s how to analyze the gap between strong sales and healthy profit, and what to do about it. Every Monday, Alisha […]
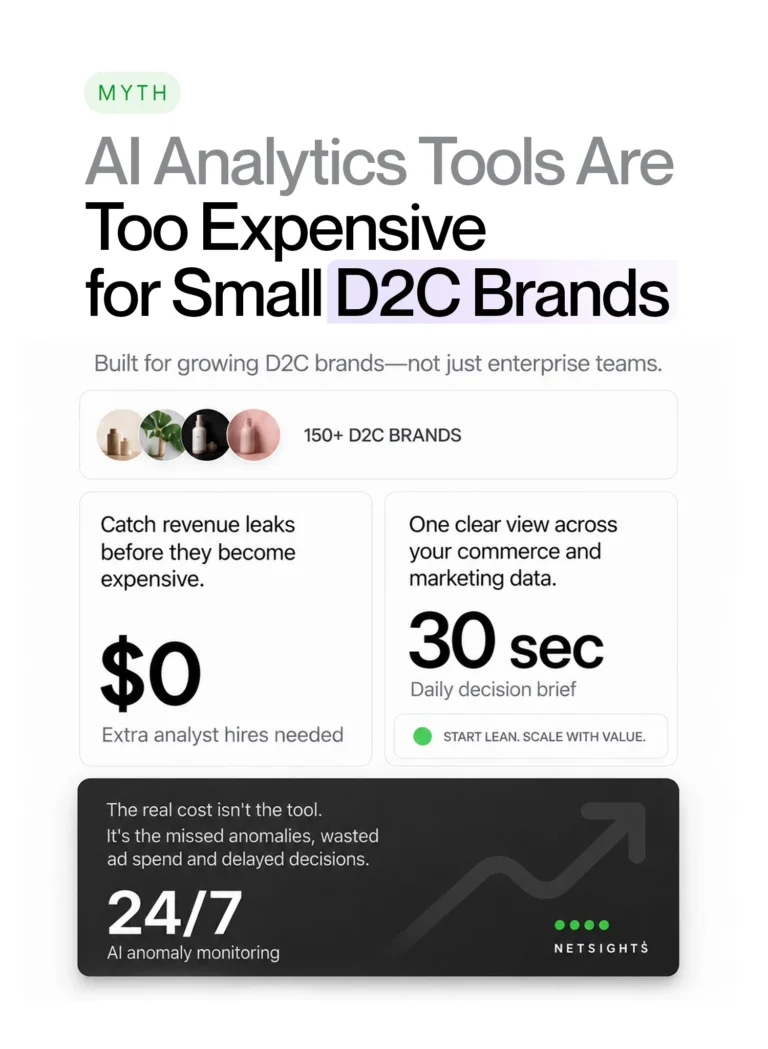
Your ecommerce store already contains the answers. Learn how AI ecommerce analytics helps founders ask business questions, understand what changed and why, and move from scattered data to clearer decisions.
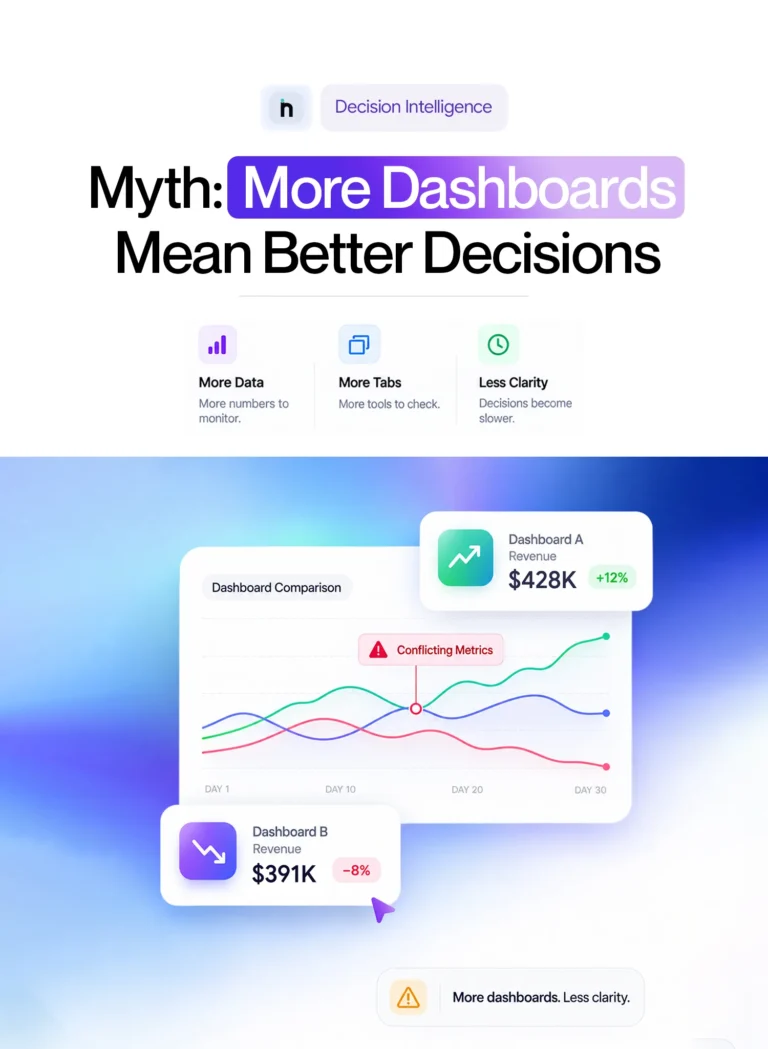
Your ecommerce store already contains the answers. Learn how AI ecommerce analytics helps founders ask business questions, understand what changed and why, and move from scattered data to clearer decisions.