
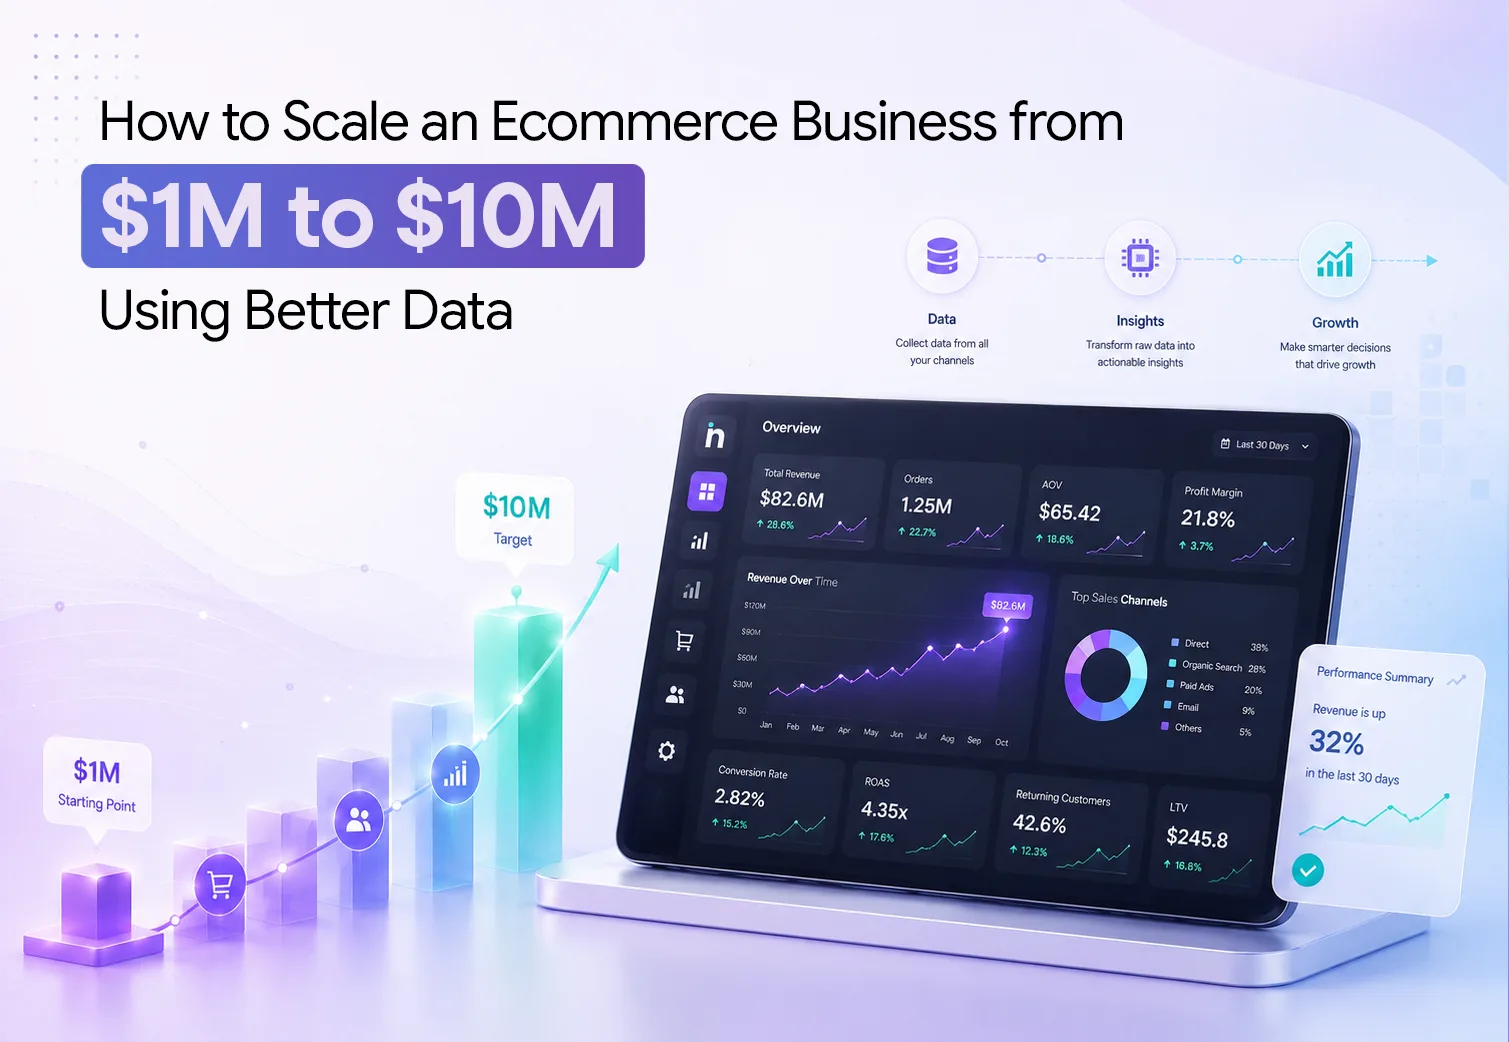
Crossing $1 million in revenue is a big win. It proves people want what you sell. Your acquisition model works. Your business has momentum.
But getting to $10 million is a different game.
At that stage, growth gets harder. Ad costs rise. Customer behaviour changes. Inventory becomes more complex. Small drops in conversion or margin start costing real money.
So the goal is no longer just to sell more.
It is to scale what is working without letting inefficiencies grow with you.
The key question becomes:
Where should the next dollar go, and what does the data say?
Brands that scale well do not simply spend more. They know which customers, channels and products are actually worth backing.
Ecommerce still has plenty of room to grow globally. UN Trade and Development (UNCTAD) reports that ecommerce sales are expanding significantly faster than GDP, showing how important digital commerce has become to the wider economy. But a growing market does not guarantee a profitable business. Brands still need to acquire customers efficiently, retain them, protect margins, manage inventory and invest carefully.
That is why the journey from $1 million to $10 million is about more than increasing revenue. It is also about changing how the business operates. Founder instinct may help build the early business, but scaling requires a more connected and data-driven approach to growth.
Scale what works. Catch what leaks. Know where the next dollar should go.
Scaling an ecommerce business is not about improving one metric. Several parts of the business need to get stronger at the same time.
Customer acquisition must stay efficient as ad spend grows. Conversion rate and Average Order Value should improve so the business gets more value from existing traffic.
Retention also needs to play a bigger role. A brand cannot keep depending only on first-time buyers. Existing customers should contribute more revenue over time.
Product and inventory decisions become more important too. The business needs to know which products are worth scaling and whether there is enough stock to support demand.
These areas are connected.
A marketing team cannot decide how much to spend without understanding contribution margin. A founder cannot judge CAC without looking at Customer Lifetime Value. A merchandising team should not push a high-performing SKU if inventory is already running low.
This is why scaling gets harder even when a brand has plenty of data.
Shopify, Meta, Google Analytics, CRM platforms and spreadsheets may all provide useful information. The problem is that each one shows only part of the picture.
To scale well, those pieces need to be connected.
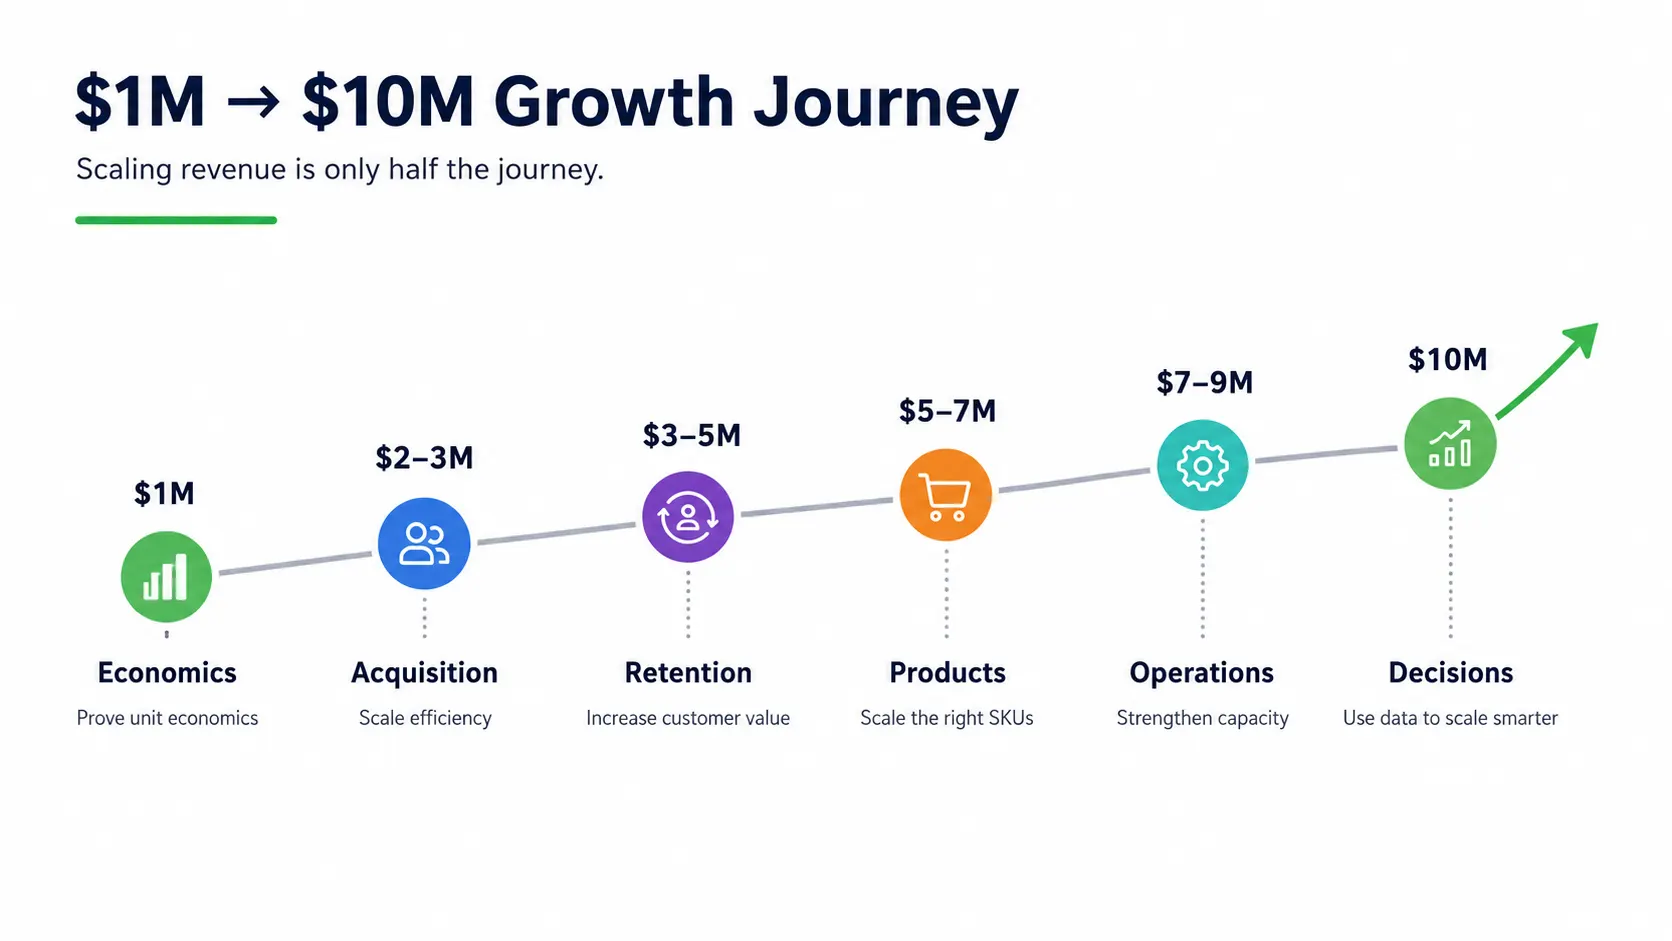
A simple way to think about the journey is:
Prove the economics → Make growth repeatable → Increase customer value → Scale the right products → Build operational capacity → Improve capital allocation
As the business moves through each stage, the questions change. The metrics the founder watches should change with them.
Growth gets harder as the business gets bigger. Your data should make the decisions easier.
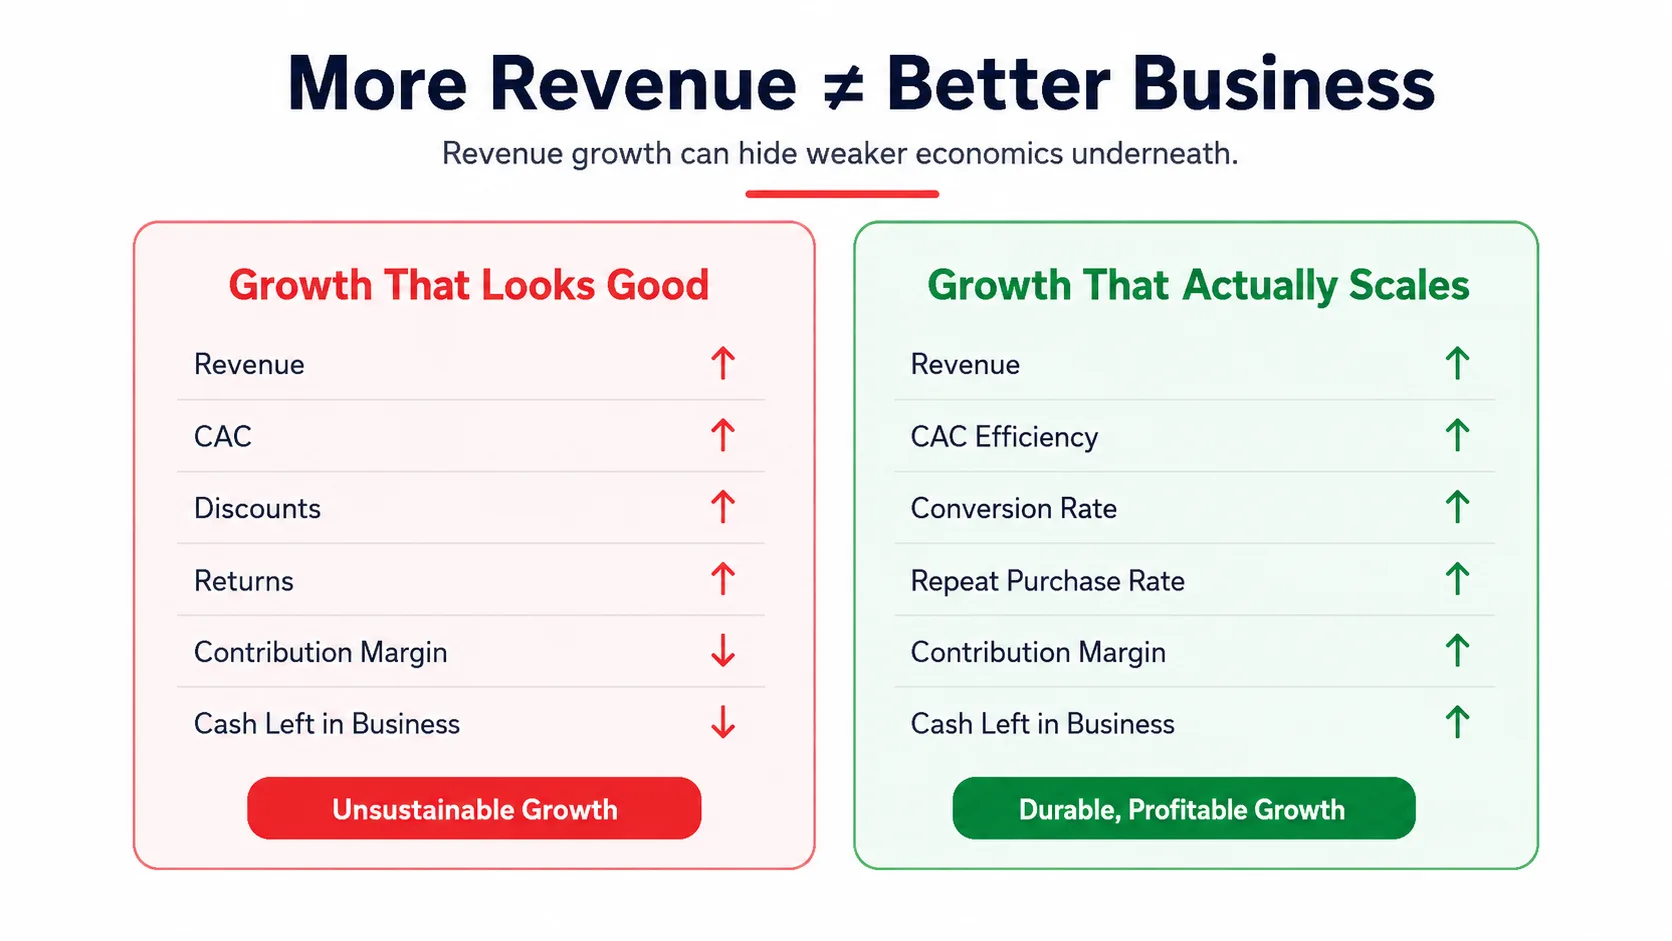
Suppose a D2C brand increases annual revenue from $1 million to $2 million. At first glance, it looks like a successful doubling of the business. But imagine that ad spend increased by 160%, discounts became deeper, Customer Acquisition Cost rose, returns increased and contribution margin weakened.
The business is generating more revenue, but the quality of that growth has declined.
Now consider another company whose revenue grows from $1 million to $2 million. Ad spend rises more slowly than revenue, conversion improves, repeat customers contribute a larger share of sales, inventory moves faster and contribution margin stays healthy.
The second company has grown more slowly on the topline, but it may be in a much stronger position to scale towards $5 million and eventually $10 million.
This is why profitable D2C growth should be assessed through the quality of revenue rather than revenue alone. A founder needs to understand not only how much the company sold, but how much economic value those sales created, how expensive the customers were to acquire, whether they returned, which products they purchased and how much cash had to be committed to create that revenue.
For a deeper view of this relationship, the Netsights guide to DTC unit economics explains why metrics such as CAC, LTV and contribution margin become increasingly important as the business grows.
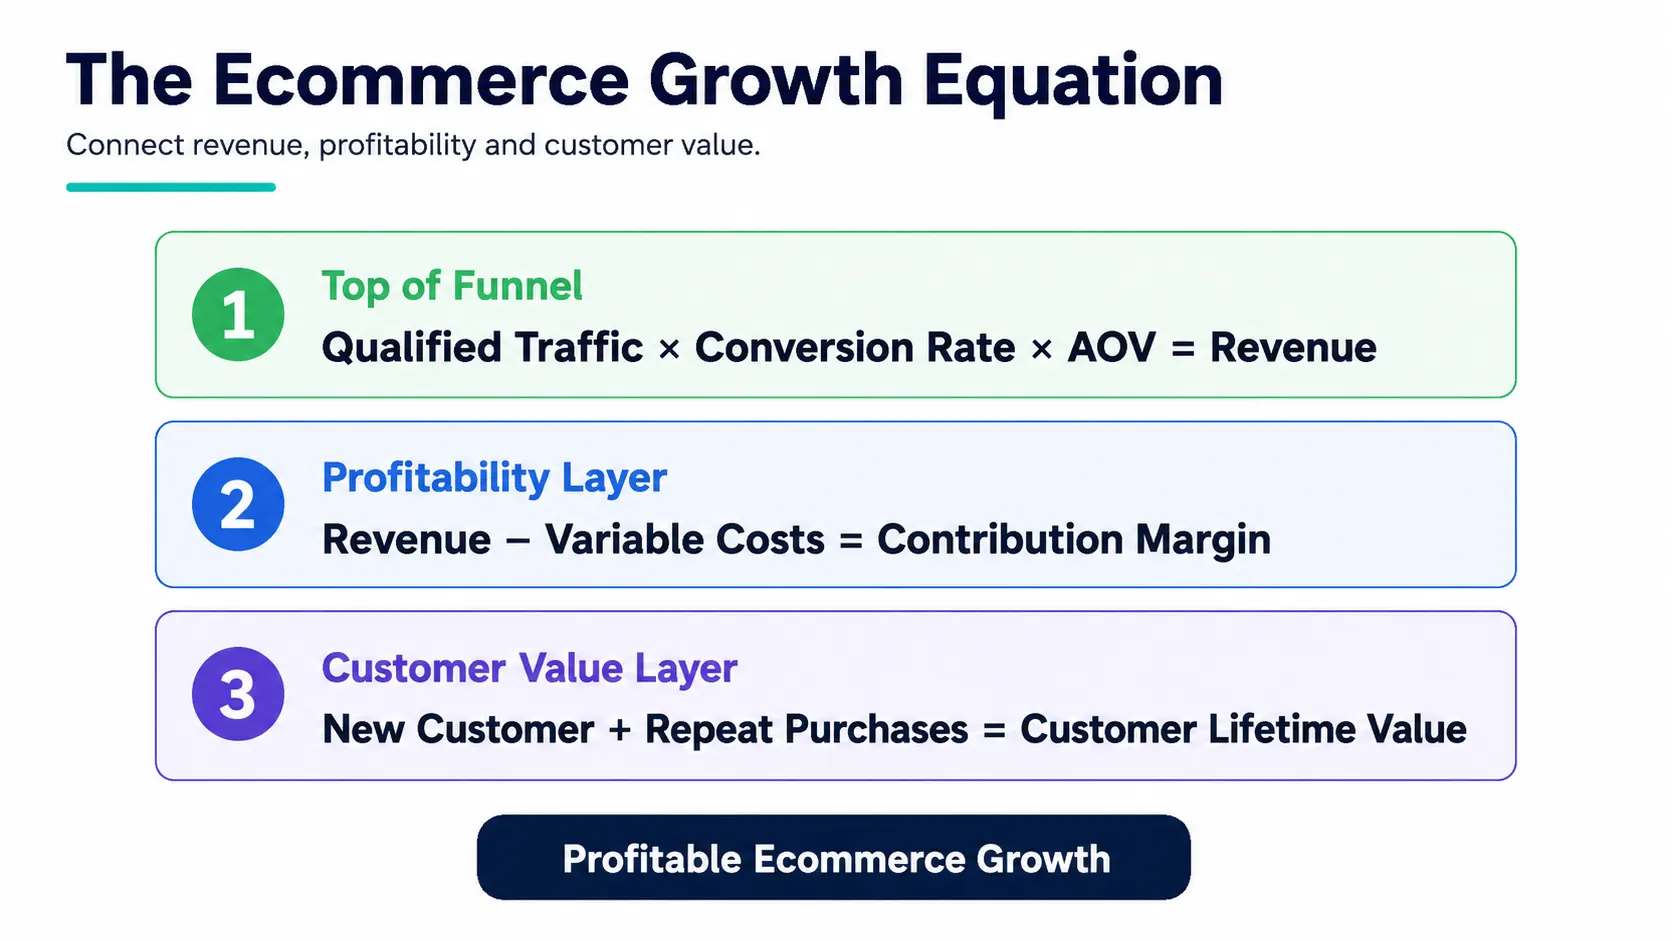
At its simplest, ecommerce revenue can be expressed through three core drivers:
Revenue = Qualified Traffic × Conversion Rate × Average Order Value
This creates three obvious growth opportunities. A brand can attract more qualified traffic, convert a greater proportion of existing visitors, or increase the value of the average basket.
The problem is that this equation explains revenue growth, not profitable growth.
A second layer therefore needs to be added:
Revenue → Variable Costs → Contribution Margin
And a third layer considers the value created after the first transaction:
New Customer → Repeat Purchases → Customer Lifetime Value
This is why a strong ecommerce growth dashboard cannot consist only of revenue, sessions and platform ROAS. Those metrics tell the founder what happened at the top of the funnel, but they do not reveal whether the business is becoming more economically attractive as it scales.
These are also consistent with the metrics commonly used to evaluate ecommerce performance. Shopify’s current ecommerce KPI framework highlights measures such as conversion rate, Average Order Value, Customer Acquisition Cost and Customer Lifetime Value, while recommending that businesses choose KPIs based on their current objectives rather than attempting to monitor everything equally.
At around $1 million in revenue, the founder should resist the urge to ask, “How do we triple sales?”
A better question is:
“Which parts of our growth model are profitable, repeatable and worth scaling?”
This stage is about proving that the economics of the business are strong enough to support more investment.
Customer Acquisition Cost, or CAC, is often treated like one fixed number. In reality, there are several ways to look at it.
A media buyer may focus on the cost per new customer reported by Meta. A founder may need a broader blended CAC that includes spend across Meta, Google, influencers, affiliates and other acquisition channels.
Both numbers are useful, but they answer different questions.
Campaign-level CAC helps marketers optimise individual campaigns. Blended CAC helps the business understand how much it is really spending to acquire a new customer overall.
This becomes more important as the company grows. Several channels may influence the same purchase, while retargeting can look highly efficient even when much of the demand was created elsewhere.
CAC becomes far more useful when it is compared with customer value. The Netsights guide to CAC versus LTV for D2C profitability explains why acquisition cost should never be judged on its own.
For example, a $100 CAC could be attractive if that customer generates $500 in profitable value across several purchases.
The same $100 CAC could be unsustainable if the customer places one discounted $120 order and never comes back.
Revenue is psychologically powerful because it is easy to understand and easy to celebrate, but revenue is not the amount of money available to reinvest in growth.
From every order, the business may need to pay for the product itself, packaging, shipping subsidies, payment charges, discounts, marketplace commissions, fulfillment costs and returns. Depending on how the company calculates contribution, certain marketing or variable service costs may also be included.
What remains gives the founder a much clearer view of whether the order creates economic value.
Imagine two products that each generate $25,000 in annual revenue.
Product A has strong margins, low return rates and customers who often come back to buy again. Product B depends heavily on discounts, costs more to fulfil and has a higher return rate.
Both products generate the same revenue, but Product A is likely the stronger product to scale.
A revenue dashboard may make them look equally valuable.
A contribution-margin view reveals that they are completely different growth opportunities.
This is why ecommerce contribution margin should become one of the central founder metrics before aggressive scaling begins.
The $1M–$3M stage is also where founders should identify which parts of the business are generating the most profitable and repeatable growth.
Perhaps one product is responsible for the majority of contribution even though another product generates more revenue. Maybe one acquisition channel produces customers with a lower first-order ROAS but much stronger repeat behaviour. Perhaps bundles increase AOV enough to make paid acquisition more efficient, or organic customers turn out to be substantially more valuable over twelve months.
These patterns help answer an important scaling question:
What should we deliberately do more of?
This is very different from simply increasing every marketing budget.
Scaling works better when capital follows evidence.
Once the brand knows its basic unit economics are working, the next challenge is repeatable growth.
A business may reach $2 million in revenue because one product performs exceptionally well, one creative takes off, or one paid-media audience delivers unusually strong results.
But those advantages may not last forever.
As the brand grows, it needs an acquisition system that can perform consistently without depending on one campaign, one product or one lucky win.
As advertising budgets increase, high-intent audiences can become saturated. Creative fatigue can reduce response rates. Cost per thousand impressions can increase. The business may need to reach colder audiences that are less likely to convert.
As a result, one of the most important questions at this stage becomes:
How efficient is the next dollar of acquisition spent compared with the dollars we are already spending?
Imagine a brand spends $100,000 on advertising and generates $400,000 in sales. It then increases ad spend to $150,000, while total sales rise to $480,000.
At first, the decision looked successful because revenue increased.
But the extra $50,000 in ad spend generated only $80,000 in additional sales.
That means the extra budget performed much less efficiently than the original spend. This is why founders should look at incremental performance, not just overall ROAS.
This is one of the most important principles in ecommerce scaling.
The fact that existing spend performs well does not guarantee that significantly higher spend will produce the same efficiency.
Instead of asking only, “What is our current ROAS?” founders should ask:
What happens to blended CAC, contribution margin and customer quality as spend increases?
The 12-point ROAS optimisation checklist provides a broader framework for evaluating whether advertising efficiency is actually improving.
Platform-reported ROAS is useful because marketers need to know how campaigns perform within Meta, Google and other advertising environments.
Blended ROAS answers a different question. It compares total advertising investment with the revenue generated by the ecommerce business.
This matters because attribution can overlap. Meta may claim influence over a transaction that Google also influenced, while direct and organic traffic may have contributed to the same journey.
For campaign optimisation, platform data remains essential.
For founder-level decision-making, blended metrics provide an additional layer of business context.
A customer can be profitable over their lifetime and still create a short-term cash-flow problem if the business takes too long to recover the amount spent acquiring them.
Suppose a brand spends $120 to acquire a customer who eventually generates $400 in profitable value.
The numbers may look healthy, but timing still matters.
If that value takes 12 to 18 months to come back, rapid customer acquisition can tie up a significant amount of working capital.
This is why the customer acquisition cost payback period becomes particularly important during the scale-up phase.
CAC tells you how much was invested.
LTV tells you how much value may eventually be created.
CAC payback tells you how long the business has to wait before recovering that investment.
As advertising spend becomes larger, the timing difference matters more.
Many D2C brands initially grow by focusing intensely on customer acquisition. That is logical because no retention strategy can work without customers to retain.
But as the customer base becomes larger, the economics begin to change.
A brand that repeatedly acquires customers who purchase once is effectively rebuilding part of its revenue base every month. A brand that converts a meaningful percentage of those first-time buyers into second, third and fourth purchases creates an increasingly valuable installed customer base.
Retention therefore becomes more than a CRM metric.
It becomes a growth lever.
The first transaction tells you whether the customer was willing to try the product.
The second transaction tells you something far more valuable: whether the experience was strong enough to bring them back.
A good retention analysis should therefore move beyond a simple repeat-purchase percentage and answer more detailed questions.
These insights allow retention teams, CRM professionals and performance marketers to work from the same economic framework rather than optimising separate departmental metrics.
The aim of retention is not simply to improve email engagement or WhatsApp response rates.
The business outcome is to increase the economic value generated by customers the company has already paid to acquire.
The Netsights article on customer retention versus acquisition explores why sustainable growth requires the two strategies to work together.
Retention also becomes more sophisticated as the customer base grows. Instead of sending the same communication to every buyer, brands can use purchase history, product affinity, behavioural signals and predicted customer needs to create more relevant experiences. McKinsey’s work on AI-powered customer experiences and retention describes how analytics, predictive models and AI can help businesses determine more relevant next interactions with customers.
Customer Lifetime Value shows how much value a customer can generate over their full relationship with the brand. Shopify’s Customer Lifetime Value guide explains it using Average Order Value, purchase frequency and customer lifespan.
For a scaling D2C brand, the key lesson is simple: do not judge acquisition only by the first order.
Consider two customer cohorts.
The first costs $85 to acquire and generates an average first order of $150, but very few customers return.
The second costs $110 to acquire and generates a first order of $140, but many of those customers come back and purchase again.
If the marketing team looks only at first-order CAC, the first cohort appears stronger.
But if the founder looks at 12-month customer value, contribution and repeat purchases, the second cohort may be far more valuable.
This is why Customer Lifetime Value changes how much a brand can afford to spend on acquisition.
A business with strong retention can often accept a higher first-order CAC because those customers may create more value over time.
As a D2C brand becomes larger, product-level economics begin to influence growth more heavily.
A product catalogue naturally develops different roles. Some SKUs acquire new customers. Some generate high contribution margins. Some increase AOV through bundling. Others create repeat purchases, while a few may generate impressive revenue but also high return rates or operational complexity.
The mistake is evaluating every SKU through one metric.
Revenue rankings alone are not enough.
Consider two products:
Metric | Product A | Product B |
Annual revenue | $24,000 | $18,000 |
Gross margin | 44% | 62% |
Return rate | 13% | 4% |
Repeat behaviour | Low | High |
Inventory turnover | Slow | Fast |
If the founder sorts the product report by revenue, Product A appears stronger.
Once profitability, returns, customer behaviour and cash efficiency are considered, Product B may deserve significantly more investment.
This is why metrics for scaling an ecommerce business need to connect product performance with financial and customer outcomes.
Otherwise, a brand can accidentally spend more money promoting the products that create impressive topline growth but weaker underlying economics.
The guide to hidden ecommerce profit leaks explains several ways this can happen without immediately appearing in revenue reporting.
A fast-growing ecommerce company can be profitable and still run into a cash problem.
This happens because growth often requires investment before the related revenue arrives.
Inventory may need to be ordered weeks or months in advance. Suppliers may require deposits or early payment. Advertising spend is paid before the customer becomes profitable over their lifetime. Warehousing, fulfilment and staffing expenses may increase before sales reach the level required to cover them.
This makes ecommerce cash flow management a direct part of the growth strategy.
As D2C brands become larger, scaling may also extend beyond the brand’s own ecommerce store. Marketplaces, offline retail and omnichannel distribution can introduce new revenue opportunities, but they also add complexity around inventory, margins and attribution. Redseer’s research on omnichannel strategies for D2C brands examines this shift in the Indian market and highlights why the next stage of brand growth may require a broader operating model rather than simply more online advertising.
Suppose a hero product is producing excellent advertising returns and conversion is rising.
From a marketing perspective, the obvious response is to increase the budget.
However, inventory data shows only three weeks of stock remaining and the next purchase order will not arrive for six weeks.
Increasing demand could now create stockouts, wasted advertising spend and disappointed customers.
Nothing in the advertising report is technically wrong.
The business context has changed.
The opposite problem is also common. A company purchases too much inventory based on optimistic demand forecasts and eventually uses heavy discounts to clear stock. Revenue remains healthy while contribution margin and cash flow deteriorate.
At the $7M–$10M stage, inventory can no longer be treated as a back-office metric. It becomes a core part of growth planning and decision-making.
It becomes part of the growth model.
Suppose the business wants to generate an additional $200,000 in revenue over the next twelve months.
Before approving that target, the founder should ask what the revenue increase will require financially.
How much additional inventory must be purchased? When will suppliers need to be paid? How much incremental marketing investment is required? How long will CAC take to recover? How much money could become trapped in slower-moving stock? What happens if returns rise or expected repeat purchases arrive later than forecast?
These are no longer purely finance-team questions.
They are D2C financial metrics that influence how aggressively the company can grow.
A $10 million revenue target only makes sense if the business has enough cash, inventory and operational capacity to support the demand needed to reach it.
The right metrics depend on the decisions the business needs to make at each stage of growth. A dashboard that works at $1 million in revenue may become too noisy or less useful as the business approaches $10 million, because the priorities and risks change along the way.
A practical stage-based framework looks like this:
Revenue Stage | Main Question | Priority Metrics |
$1M–$3M | Does the business model work economically? | CAC, conversion rate, AOV, contribution margin |
$2M–$4M | Are customers creating value after acquisition? | Repeat purchase rate, LTV, second-order rate |
$3M–$5M | Can customer acquisition scale efficiently? | Blended CAC, blended ROAS, CAC payback |
$4M–$7M | Which products deserve more investment? | SKU contribution, return rate, product concentration |
$5M–$8M | Can operations support growing demand? | Inventory cover, stockouts, fulfilment efficiency |
$7M–$10M | Can growth remain financially sustainable? | Cash flow, contribution margin, LTV:CAC, forecast vs target |
These ranges are not universal industry benchmarks. A beauty brand with frequent replenishment behaves differently from jewellery, home furniture or electronics.
The important principle is that growth-stage ecommerce KPIs should reflect the decisions the business is currently making.
Better reporting also needs to connect commercial growth with operational and financial discipline. Deloitte’s 2026 Retail Industry Global Outlook identifies customer centricity, financial prudence, operational excellence and data-driven insight among the fundamentals that remain important for sustainable retail performance. These are useful principles for D2C founders because a growth dashboard should not isolate marketing performance from margin, customers and operations.
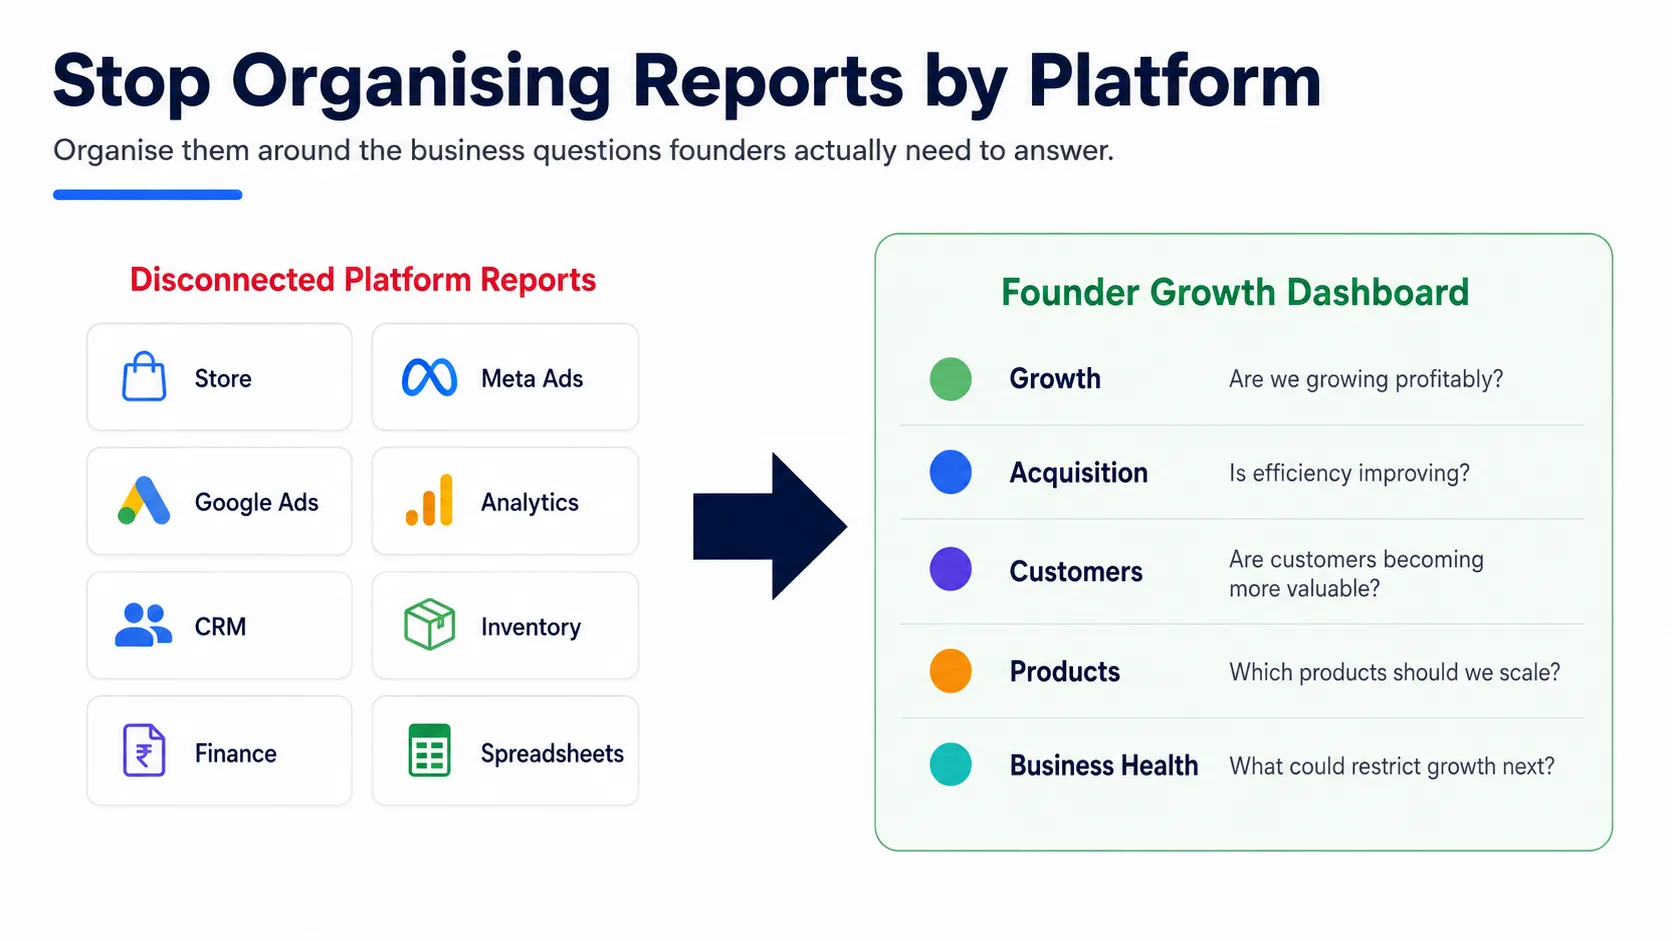
One of the most common reporting problems in ecommerce is that dashboards are organised around software platforms rather than business decisions.
That structure may be convenient for the systems producing the data, but it does not reflect how founders actually think.
A founder is much more likely to ask:
The ecommerce growth dashboard should therefore be structured around those questions.
A founder-level view can be organised into five connected areas: growth, acquisition efficiency, customer value, product economics and business health. Revenue, orders, AOV and conversion explain growth. Blended CAC, blended ROAS and CAC payback explain acquisition efficiency. Repeat purchase rate and LTV explain customer quality. Product contribution, returns and stock exposure explain merchandising economics. Cash requirements, inventory risk and forecasts explain whether the organisation can support the next stage.
This approach also reduces the decision fatigue created by fragmented analytics.
The purpose of a dashboard should not be to make every available KPI visible.
It should reduce the amount of uncertainty surrounding important decisions.
A dashboard showing that conversion rate declined from 3.1% to 2.5% has provided useful information, but it has not yet provided an explanation.
The business still needs to investigate what changed.
Perhaps mobile conversion weakened. Maybe a high-performing campaign stopped running. Traffic mix may have shifted towards lower-intent visitors. Product availability could have declined. A promotional offer may have ended, or checkout friction may have increased.
This is where the difference between conventional reporting and ecommerce decision intelligence becomes important.
The goal of better analytics is not only to surface the movement in the KPI. It is to connect that movement with related signals so that the team can narrow the investigation.
Instead of stopping at:
“Conversion fell.”
The reporting system should help the team move towards:
“Conversion fell primarily on mobile after paid-social traffic increased, while desktop conversion remained stable. Mobile landing-page performance should be investigated first.”
That does not eliminate the need for human judgement.
It makes that judgement faster and more informed.
Connected data becomes especially useful when metrics move in different directions.
If revenue increases but contribution margin falls, investigate discounting, product mix, shipping costs, acquisition efficiency and returns rather than assuming the revenue increase is automatically positive.
If ROAS declines while conversion remains stable, the website may not be the primary problem. Rising media costs, audience saturation, creative fatigue or spend allocation may deserve closer attention.
If traffic rises while revenue remains flat, look at conversion rate, traffic quality, landing-page relevance, pricing and product availability.
If CAC rises but LTV rises even faster, the higher acquisition cost may still be economically acceptable, although CAC payback and cash requirements should be reviewed before increasing spend further.
If new-customer revenue increases while total growth slows, retention may be weakening. Repeat purchase rate, returning-customer revenue and cohort performance should become the next area of investigation.
If a hero product accelerates while inventory cover declines, marketing and merchandising should coordinate before aggressively increasing demand.
This is what a practical data-driven growth strategy for D2C brands should do: turn multiple metrics into a coherent business explanation rather than asking teams to interpret every dashboard separately.
At $1 million in revenue, spotting an underperforming campaign three days late may be frustrating but manageable.
At $10 million, the same delay can be far more costly because ad budgets, traffic volumes and inventory exposure are much larger.
The purpose of reporting therefore changes as the company grows.
Reporting should not simply document what happened after the fact. It should help the team identify meaningful changes early enough to respond.
This is where automated ecommerce reporting and ecommerce analytics automation become increasingly valuable.
Recurring data collection, KPI calculations and reporting workflows can be automated so that teams spend less time preparing information and more time reviewing the exceptions that require action.
A mature reporting process should answer three questions quickly:
What changed? Why might it have changed? What should the team investigate or do next?
If teams are still spending hours every week exporting data and updating spreadsheets, the guide on how to reduce ecommerce reporting time from five hours to fifteen minutes explains how reporting workflow automation can reduce repetitive preparation work.
Better growth starts with better visibility into what is working, what is weakening and what to do next.
Consider a hypothetical skincare brand generating approximately $1M annually through its Shopify store.
The company has a hero product, relies heavily on paid social and initially reviews performance mainly through revenue, platform ROAS and monthly spreadsheets.
The hero product generates most sales, but deeper analysis shows that heavy discounting and shipping subsidies are reducing contribution margin.
A second product generates less revenue but produces stronger contribution and much better repeat behaviour.
Instead of simply increasing media spend behind the bestseller, the company improves its bundles, adjusts pricing and shifts more promotion towards the economically stronger product.
The first scaling decision is therefore not “buy more traffic.”
It is to improve the economics of the revenue already being generated.
As the brand spends more on paid media, blended CAC begins to rise.
The marketing team initially considers reducing the campaigns with higher acquisition costs, but cohort analysis reveals something more important. One of those expensive campaigns produces customers with much stronger repeat behaviour.
Another campaign creates cheaper first orders but almost no repeat purchasing.
Once LTV is considered, the allocation decision changes.
The brand starts evaluating customer acquisition based on longer-term value rather than first-order efficiency alone.
The customer database is now significantly larger, but returning-customer revenue has not increased at the same pace.
The CRM team improves post-purchase journeys, replenishment reminders, segmentation, email campaigns, WhatsApp communication and cross-sell offers.
The objective is not simply to improve engagement metrics. It is to increase the number of customers moving from a first order to a second and third purchase.
As retention improves, every new acquisition cohort becomes more economically valuable.
That creates more room for the company to invest in acquisition.
The brand now has several high-volume SKUs.
One product starts generating exceptional campaign performance, and the advertising team wants to increase the budget. Inventory data shows that the product could sell out before replenishment arrives.
Instead of maximising short-term campaign performance, the business moderates spending and redirects part of the budget towards another profitable product with sufficient stock.
At the same time, slow-moving SKUs are identified before additional purchasing decisions are made.
Marketing is no longer optimised separately from inventory.
That is an important sign that the operating model has matured.
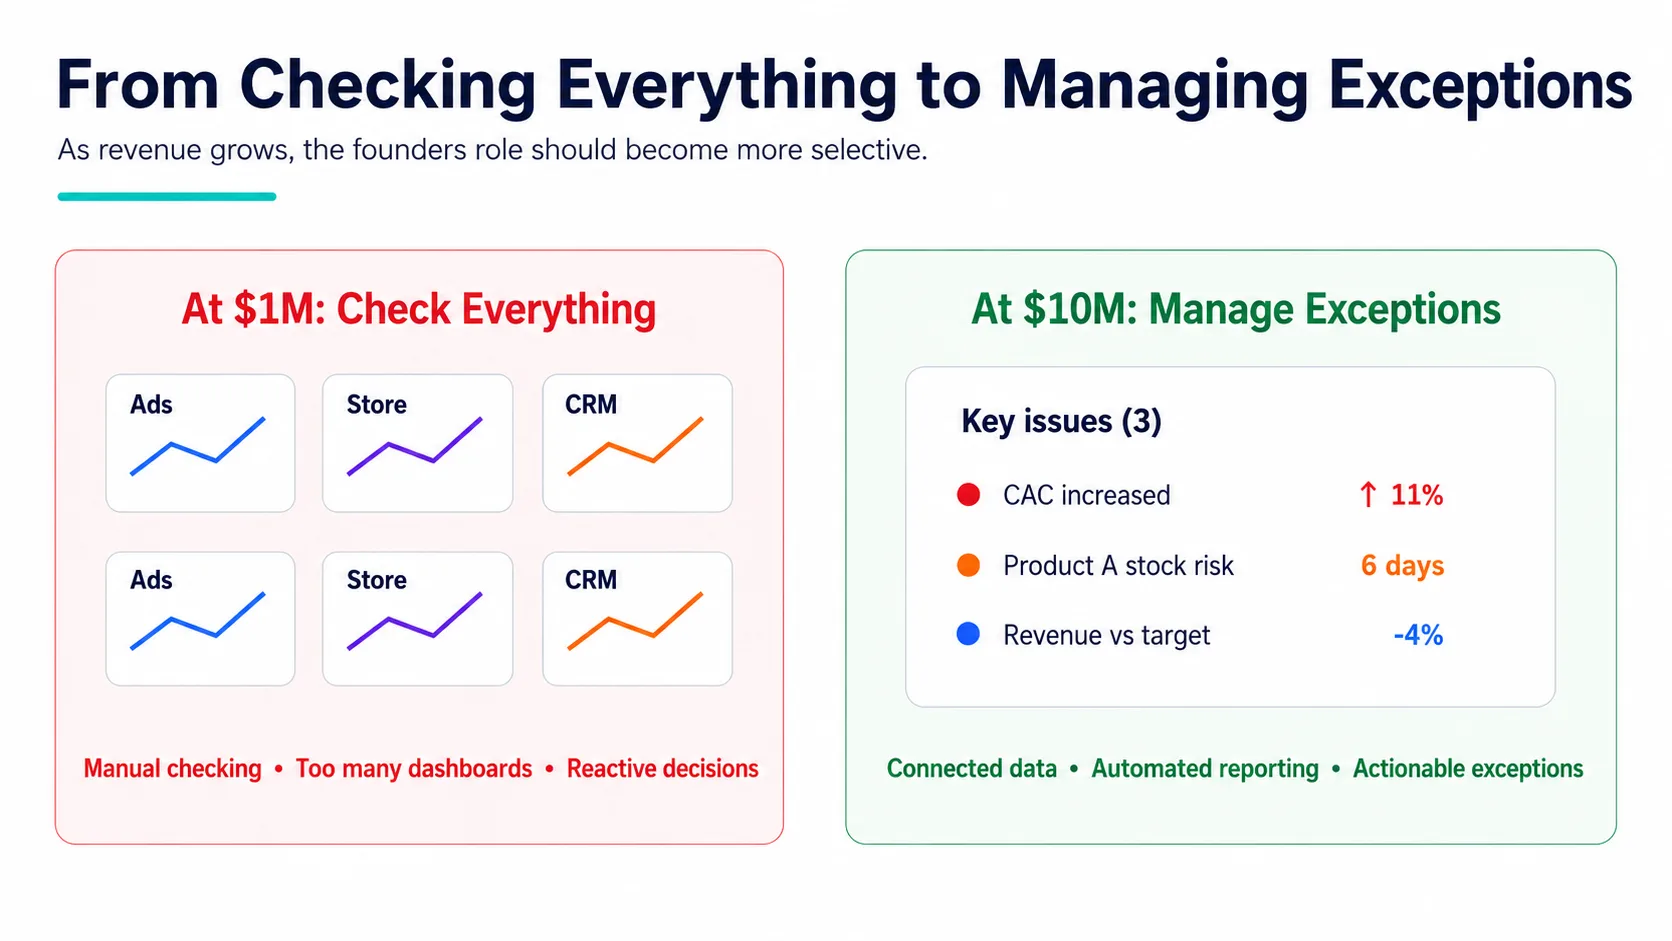
A founder does not need to inspect hundreds of metrics every Monday.
A well-designed weekly review should answer four connected questions.
First, did the business grow profitably? Revenue, orders and AOV should be reviewed alongside contribution margin so that topline growth does not hide weaker economics.
Second, did customer acquisition improve or deteriorate? Total advertising spend, blended CAC, blended ROAS, conversion and CAC payback help reveal whether incremental acquisition remains attractive.
Third, are existing customers becoming more valuable? Returning-customer revenue, repeat purchase rate, second-order behaviour and cohort LTV show whether the growing customer base is strengthening the business.
Finally, what could restrict growth next? Inventory risk, rapidly deteriorating KPIs, product concentration, cash requirements and forecast gaps help management identify problems before they become larger.
This turns weekly reporting from a presentation exercise into a decision-making process.
For a simpler recurring framework, see the five weekly ecommerce metrics founders should review.
As ecommerce businesses grow, the problem normally changes from not having enough information to having too much fragmented information.
Shopify contains order and product data. Meta and Google contain advertising data. Analytics tools contain traffic and conversion behaviour. CRM platforms contain customer engagement information, while inventory and financial information may live elsewhere.
Netsights is designed to bring these signals into a decision-intelligence layer so that founders and ecommerce teams can understand business performance in a more connected way.
Instead of forcing decision-makers to manually move between dashboards and spreadsheets, the Netsights ecosystem is designed around the progression from data to insight to action.
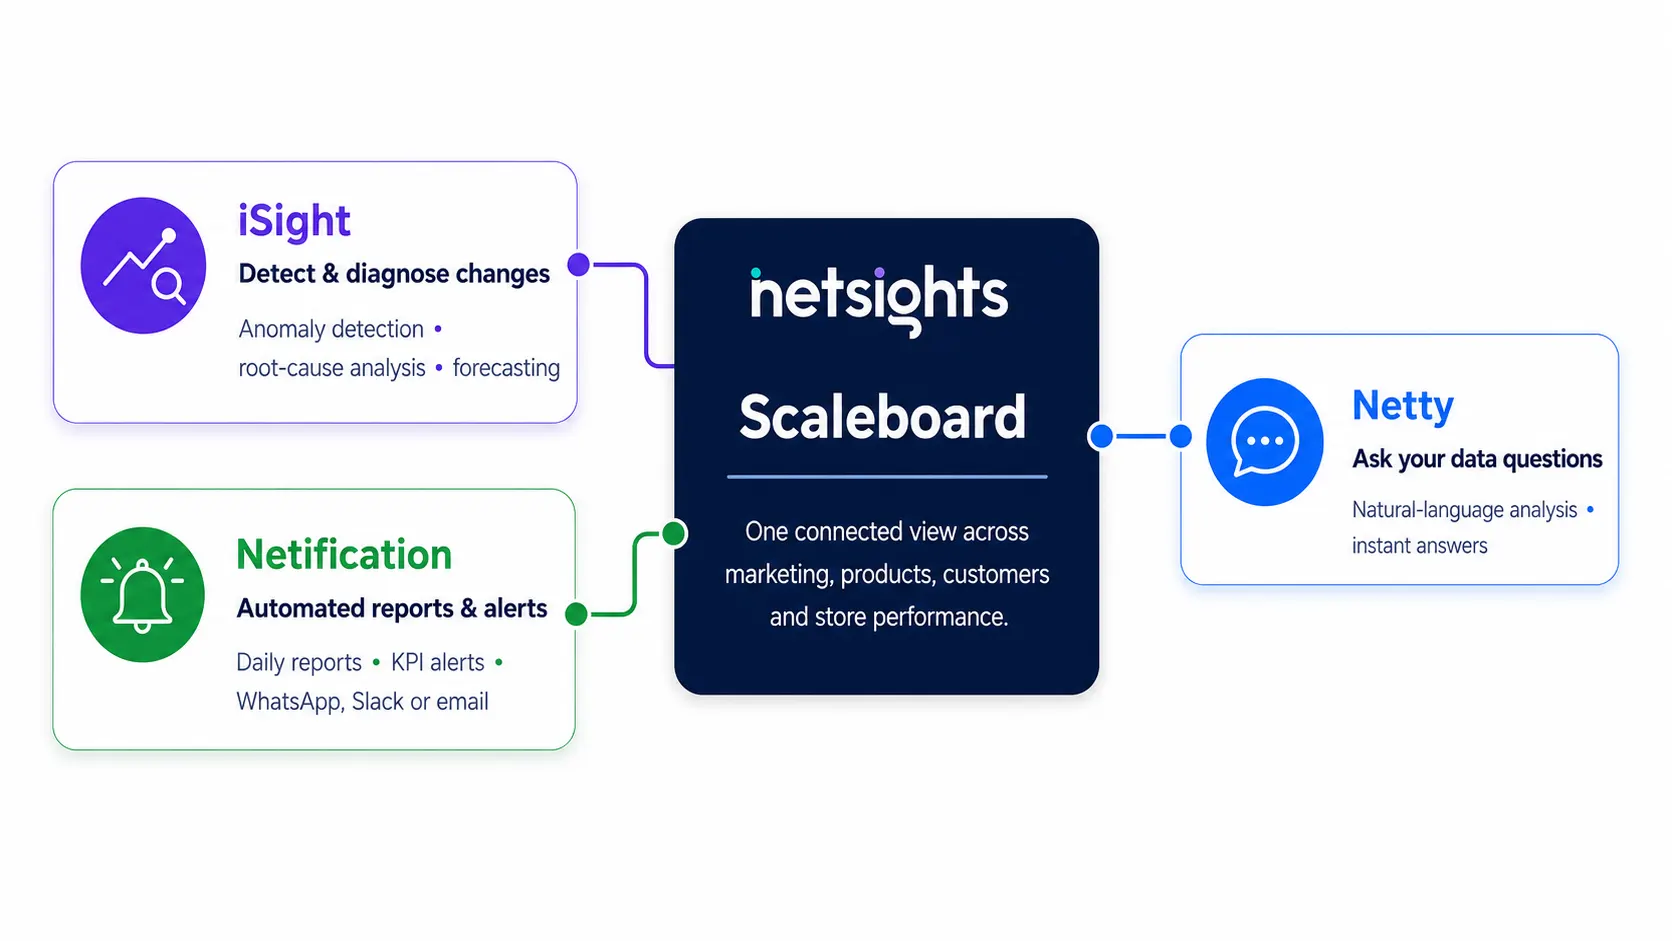
The Netsights AI Scaleboard provides a central operating view across areas such as marketing, products, customers and store performance.
The value of this approach is not simply that several metrics appear on one screen. The more important benefit is that related signals can be evaluated together.
For example, a decline in revenue may be connected with weaker advertising efficiency, a drop in conversion rate or a product availability issue. A rising CAC may look concerning until customer value and retention are evaluated. A fast-growing SKU may look attractive until inventory exposure is considered.
This is also what separates a decision-oriented Scaleboard from a traditional collection of dashboards. The objective is to reduce the amount of manual reconciliation required before the founder can understand what deserves attention.
For more context, see the comparison between Netsights Scaleboard and conventional ecommerce dashboards.
iSight is the intelligence layer within Netsights designed to continuously analyse ecommerce performance and identify significant movements.
Rather than expecting a founder to notice every anomaly manually, iSight can help surface unusual changes in important metrics and connect them with related business signals.
For a scaling D2C brand, this matters because the financial impact of reacting slowly increases with revenue.
A drop in conversion, a sudden increase in ad spend, or an unnoticed product issue can become far more expensive at $10 million in revenue than it was at $1 million.
The role of iSight is therefore not simply to create another chart.
It is to help shorten the path from “something changed” to “this is where the business should investigate first.”
Netty provides conversational access to ecommerce intelligence.
Traditional reporting requires the user to know which dashboard, report, filter or spreadsheet contains the information they need.
Founders often think differently.
They begin with a question:
A conversational interface allows the analysis to begin from the business question rather than from the location of the data.
As the organisation becomes more complex, this becomes increasingly useful because the number of possible questions grows much faster than the number of static reports a team can realistically build.
Together, Scaleboard, iSight, Netification and Netty are designed to shorten the path between:
Connected data → Performance change → Diagnosis → Decision → Action
One connected view. Fewer blind spots. Faster growth decisions.
The journey from $1M to $10M is often presented as a marketing challenge, but the reality is broader. It is simultaneously an acquisition challenge, a retention challenge, a product challenge, an inventory challenge, a cash-flow challenge and ultimately a decision-making challenge.
At $1M, founders can often compensate for weak systems by staying close to every campaign, product and customer issue. As revenue increases, that becomes increasingly difficult because there are simply too many variables changing at the same time.
A durable ecommerce growth strategy therefore needs to mature alongside the business.
First, the company should prove that its unit economics are worth scaling. It should then make acquisition repeatable, increase the value generated from existing customers, identify the products that deserve additional investment, connect inventory with demand and finally build the financial and reporting systems required to support a larger organisation.
The common thread across every stage is not more data.
It is better-connected data that improves the quality and speed of decisions.
A business moving towards $10M should be able to understand not only what happened, but what changed, why it matters, what it could cost and where the next dollar should go.
That is the difference between simply growing revenue and building a business that is genuinely capable of scaling.
Don’t just scale the revenue. Scale the intelligence behind every growth decision.
A: Scaling from $1M to $10M requires stronger unit economics, repeatable acquisition, better customer retention, disciplined product and inventory management, and a reporting system that connects growth with profitability and cash flow.
A: The most useful metrics include net revenue, conversion rate, Average Order Value, blended CAC, blended ROAS, CAC payback, contribution margin, repeat purchase rate, Customer Lifetime Value, product profitability and inventory availability.
A: No. Higher advertising spend can increase revenue while also raising CAC and weakening contribution margin. Paid acquisition should be scaled only when customer value, conversion, margin and operational capacity support the additional investment.
A: Retention increases the value generated from customers the business has already acquired. Stronger repeat purchasing can improve LTV, reduce dependence on continuous first-order acquisition and make higher acquisition investment economically sustainable.
A: Contribution margin helps founders understand how much economic value remains after variable order costs. It prevents revenue growth from being mistaken for profitable growth.
A: A customer may have strong lifetime value but still require substantial upfront acquisition investment. CAC payback shows how quickly that investment is recovered and therefore helps connect marketing growth with cash-flow planning.
A: An ecommerce growth dashboard connects acquisition, conversion, customer, product, profitability and operational metrics into a founder-level view designed to support business decisions rather than simply report platform performance.
A: Better data helps brands identify profitable customer segments, scalable acquisition channels, stronger products, retention opportunities, inventory risks and margin leaks so that growth capital can be allocated more intelligently.
A: Reporting should be automated when teams repeatedly export the same data, calculate the same KPIs and prepare the same reports. The goal should be to reduce manual preparation while keeping final business interpretation reviewable.
A: Netsights connects performance data through its Scaleboard, uses iSight to surface important changes and analysis, Netification for automated reports and alerts, and Netty for conversational access to business intelligence.
We write about growth, retention, and the numbers that actually predict what happens next for D2C brands. Have a topic you'd like us to cover? Get in touch .

A product can be a best performer in your sales charts and still money is lost on each order. Product profitability shows what is left after deducting product costs, discounts, shipping, ads, and returns. Here’s how to analyze the gap between strong sales and healthy profit, and what to do about it. Every Monday, Alisha […]
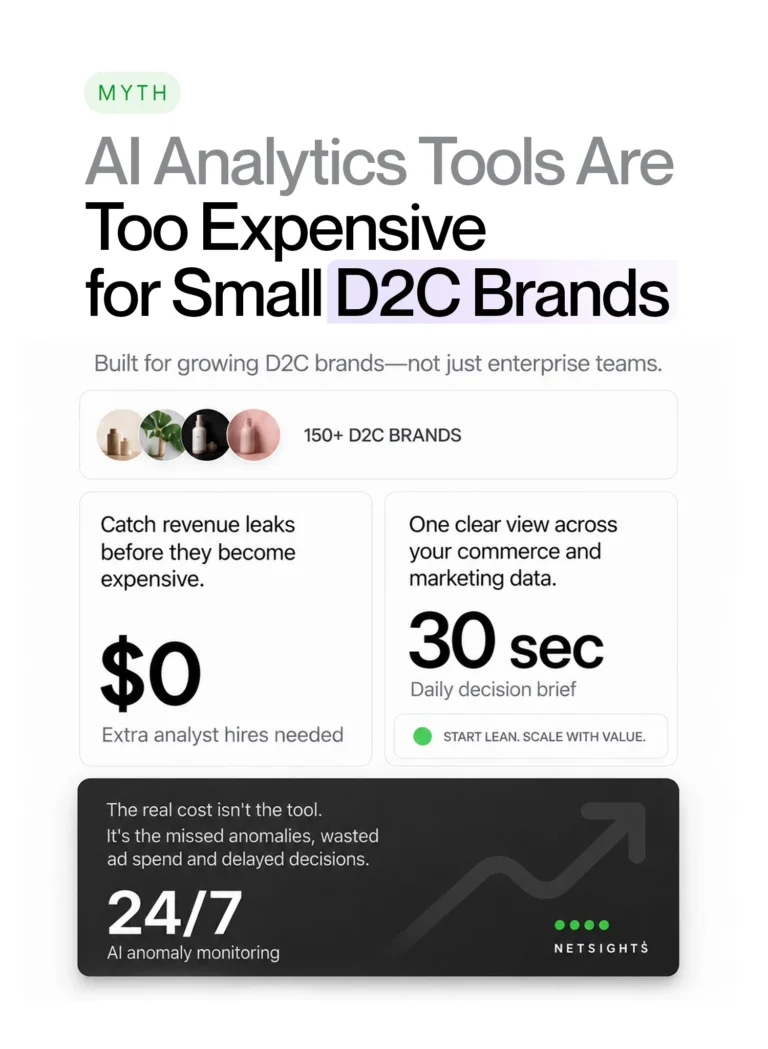
Your ecommerce store already contains the answers. Learn how AI ecommerce analytics helps founders ask business questions, understand what changed and why, and move from scattered data to clearer decisions.
Your ecommerce store already contains the answers. Learn how AI ecommerce analytics helps founders ask business questions, understand what changed and why, and move from scattered data to clearer decisions.